HORTER INVESTMENT MANAGEMENT, LLC
Weekly Commentary horterinvestment.com September 24, 2018
One of the Biggest — and Often Costliest — Retirement Mistakes Investors Are Making Today
Target-date funds are all the rage among retirement investors, making it easy to spread money among stocks and bonds and to rebalance as conditions change. Total assets in this sector topped $1.1 trillion at the end of 2017, up from $158 billion at the end of 2008, according to Morningstar. But is this too much of a good thing?
Vanguard Group, the fund giant, reported recently that 51 percent of investors in 401(k) plans with the firm put all their money into a single target-date fund in 2017, and Fidelity Investments has similar figures.
But some experts warn that this hands-off approach can backfire by failing to account for factors like the investors’ life expectancy, risk tolerance, income changes or loss of a spouse.
Target-date funds are designed for the average investor, but few investors are truly average, and many advisors say those with heavy stakes in TD funds are wise to adjust to suit their personal needs.
“Although they have substantial benefits, target-date funds ultimately provide too much of a cookie-cutter approach to asset allocation,” said Benjamin Sullivan, a planner and portfolio manager with Palisades Hudson Financial Group in Austin, Texas.
“Not everyone retiring in a given year has the same risk tolerance, cash-flow needs and time horizon. Therefore, not everyone in a cohort should have the same asset mix.”
“People need to be conscious and engaged with their investment,” said Alexander S. Lowry, director of the master’s program in financial analysis at Gordon College in Wenham, Massachusetts.


6 Social Security myths that could make or break your retirement planning
If you’re like many retirees, your Social Security checks will account for a large portion of your retirement income.
But how well you understand the ins and outs of these benefits could make a big difference in how much you receive over your lifetime.
To that point, 69 percent of baby boomers — a generation of individuals who are either in or approaching retirement — expect Social Security to be a “major” source of retirement income, according to a recent report from the Insured Retirement Institute.
In contrast, just 28 percent of those surveyed expected employer pensions, the next source of major income, to provide a main chunk of their retirement pay.

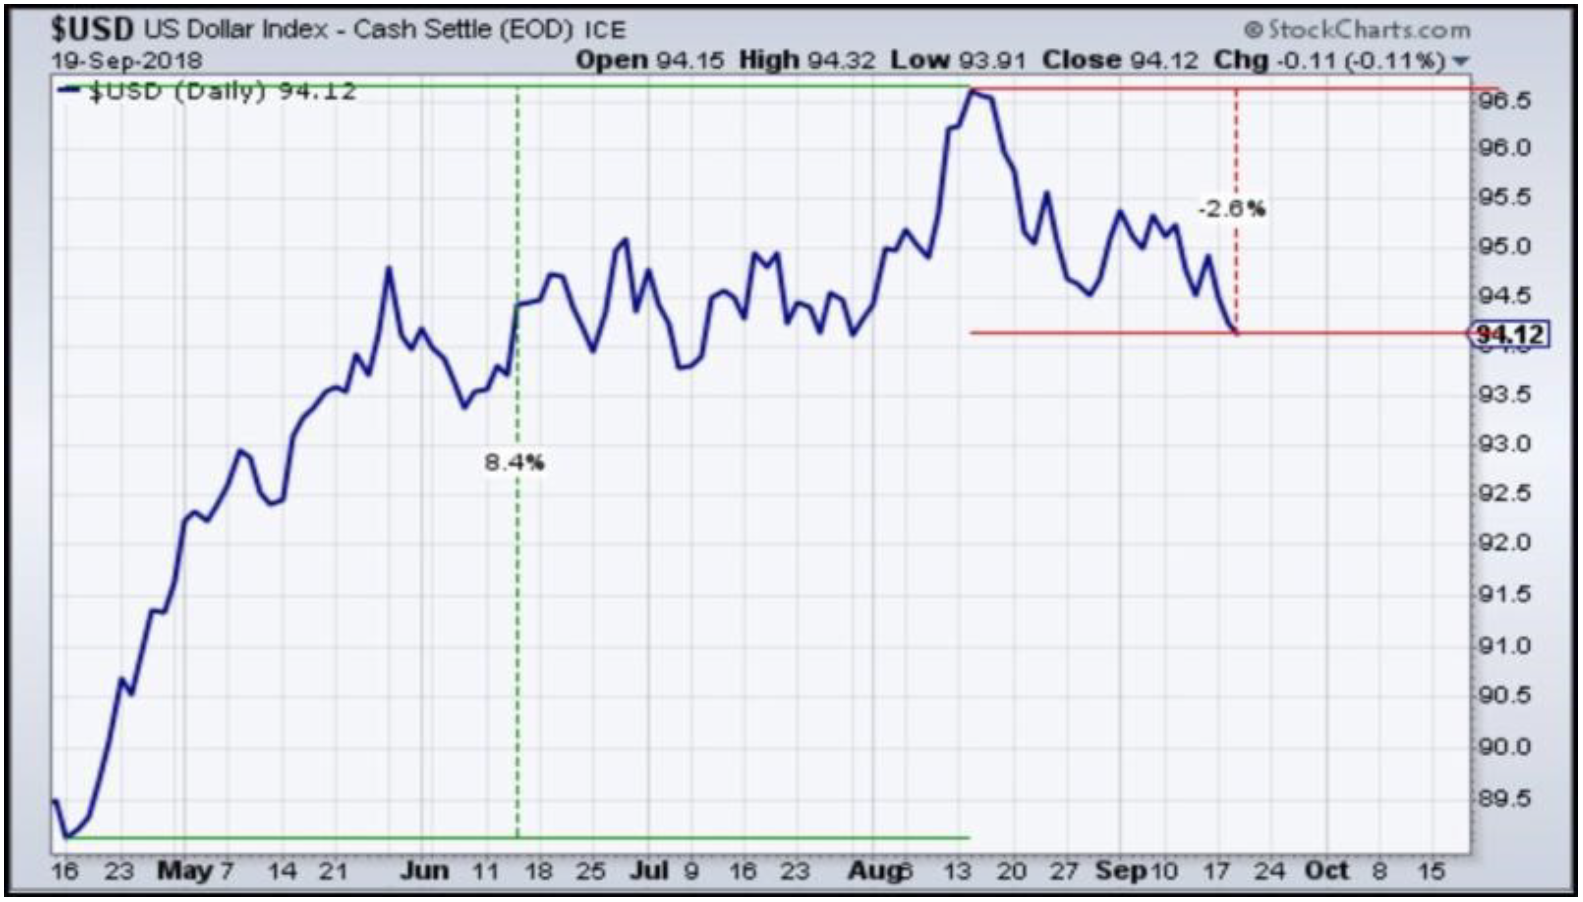
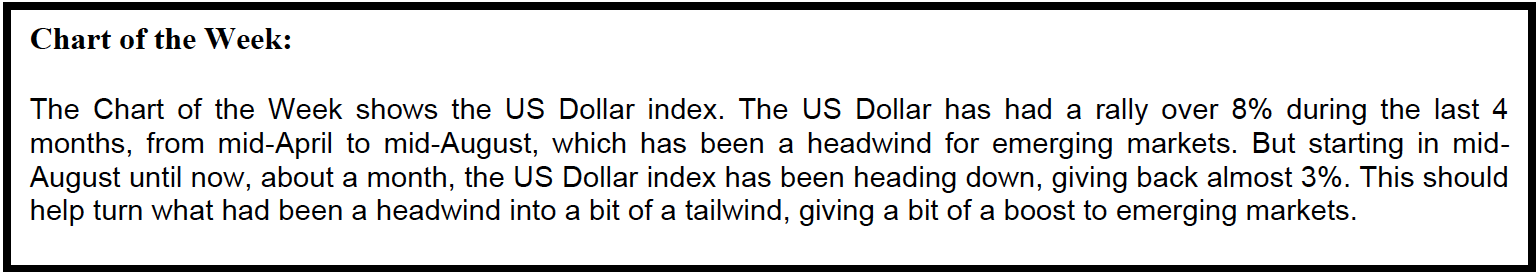
Taking a comprehensive look at the overall current stock market
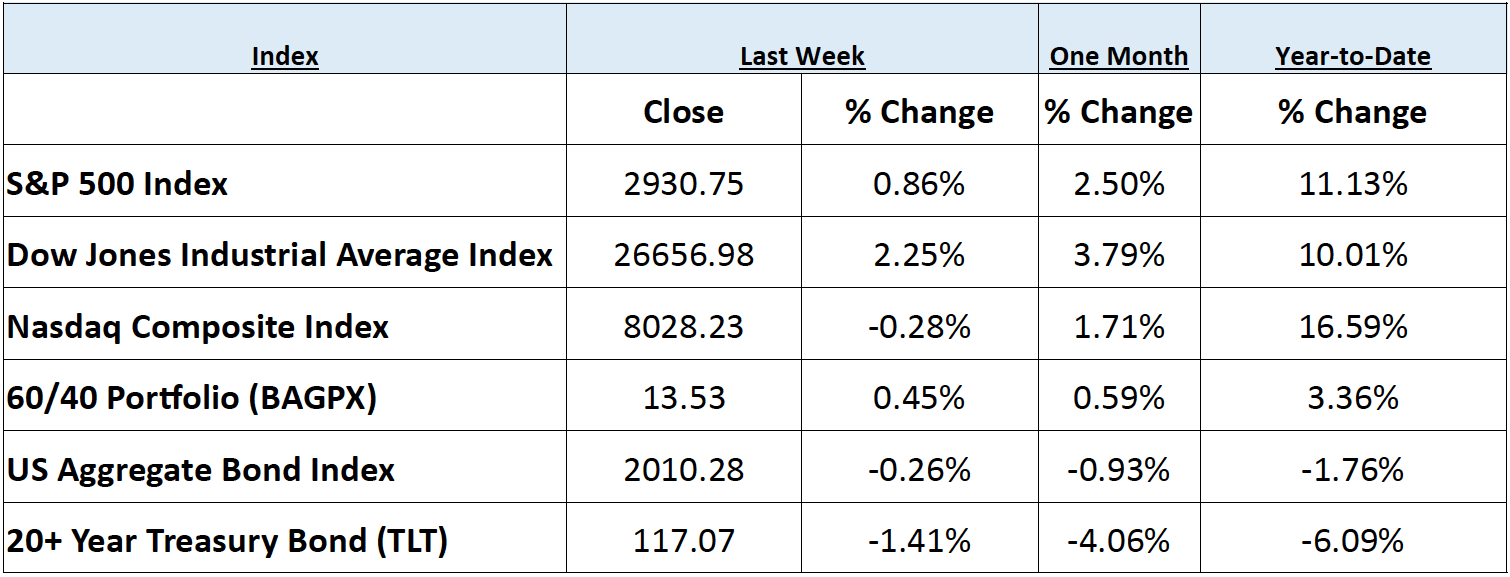
Taking a comprehensive look at the overall current stock market, you can see the chart below representing eight major indices and their returns through the week ending September 21, 2018. In a truly diversified portfolio, the portfolio’s total return is determined by the performance of all of the individual positions in combination – not individually.
So, understanding the combined overall performance of the indices below, simply average the 6 indices to get a better overall picture of the market. The combined average of all 6 indices is 5.54% year to date.
Data Source: Investors FastTrack, Yahoo Finance, Investopedia

Past performance is not a guarantee of future results. This Update is limited to the dissemination of general information pertaining to its investment advisory services and is not suitable for everyone. The information contained herein should not be construed as personalized investment advice. There is no guarantee that the views and opinions expressed in this newsletter will come to pass. Investing in the stock and bond markets involves gains and losses and may not be suitable for all investors. Information presented herein is subject to change without notice. Horter has experienced periods of underperformance in the past and may also in the future. The returns represented herein are total return inclusive of reinvesting all interest and dividends.
The above equity, bond and cash weightings are targets and may not be the exact current weightings in any particular client account. Specifically, there may be cases where accounts hold higher cash levels than stated in these target weightings. This is usually to accommodate account level activity. Furthermore, some variable annuity and variable universal life accounts may not be able to purchase the exact weightings that we are indicating above due to specific product restrictions, limitations, riders, etc. Please refer to your client accounts for more specifics or call your Horter Investment Management, LLC at (513) 984-9933.
Investment advisory services offered through Horter Investment Management, LLC, a SEC-Registered Investment Advisor. Horter Investment Management does not provide legal or tax advice. Investment Advisor Representatives of Horter Investment Management may only conduct business with residents of the states and jurisdictions in which they are properly registered or exempt from registration requirements. Insurance and annuity products are sold separately through Horter Financial Strategies, LLC. Securities transactions for Horter Investment Management clients are placed through TCA by E*TRADE, TD Ameritrade and Nationwide Advisory Solutions.
For additional information about Horter Investment Management, LLC, including fees and services, send for our disclosure statement as set forth on Form ADV from Horter Investment Management, LLC using the contact information herein. Please read the disclosure statement carefully before you invest or send money.
Dow Jones – Week Ending
WEEKLY MARKET SUMMARY
Global Equities: The Dow Jones Industrial Average and the S&P 500 were able to thwart the trade war bogeyman and rising interest rates to notch new all-time record highs, while finishing the week up 2.2% and .8%, respectively. The Nasdaq trailed the major US indices, losing around .35% during the week. Financial stocks benefited from an increasing term premium, expected to increase their net interest margin, and edged out Materials to lead all sectors with a 1.9% weekly gain for its SPDR Select Financials ETF (XLF). The interest rate sensitive Utilities sector trailed all of the other major sectors, losing nearly 2%. International equities continued their comeback, as the iShares MSCI Emerging Markets Index ETF (EEM) gained nearly 3%, while International Developed markets represented by the iShares MSCI EAFE Index Fund ETF (EFA) shared similar gains for the week.
Fixed Income: The yield on the 10 Year US Treasury easily broke through the psychological 3% level during the week, without testing the next technical resistance level near 3.10% and finishing just under 3.07%. The 10 year versus 2 year Treasury yield spread widened to the largest point since mid-August and significantly off the lows of .189%, closing the week near .266%. Lipper reported net inflows of $1.017 billion for corporate investment grade bond funds and $967 million for high yield bond funds for the week ended September 19th.
Commodities: Oil prices increased during the week, despite President Trump urging the “OPEC monopoly” to lower prices and news from Reuters that OPEC is considering raising oil output by 500,000 barrels per day to counter falling supply out of Iran. Both major oil benchmarks ended the week higher, with the American West Texas Intermediate (WTI) gaining over 2.5%, up to $70.75 per barrel, while the International Brent crude benchmark gained .8%, closing out near $78.72 per barrel. Natural gas prices traded higher during the week, to $2.98/MMBtu.
WEEKLY ECONOMIC SUMMARY
PMI Composite FLASH: The early estimate for the Purchasing Managers’ Index Composite surprised to the downside, coming in at 53.4 versus the consensus estimate of 55.1 for the month of September. The weakness of this survey-driven gage of private sector output was dragged down by the service sector respondents’ concerns for rising input pressure in the future outlook, driven largely by labor costs. This was enough to offset strong readings for new orders, increasing backlogs, and new hiring in the sector. The measure for the manufacturing sector surprised to the upside as rising orders and production offset similar concerns for rising input prices, this time for raw materials, that are largely expected to be passed on to end consumers.
Housing Starts: Housing starts for the month of August came in higher than the consensus range, up over 9% from the prior month’s upwardly revised seasonally adjusted annualized rate of 1.174 million to 1.282 million, with the important single-family housing start count rising nearly 2%. Conversely, the forward-looking number of new building permits was well below the consensus estimate of 1.315 million, at 1.229 million, which may be an ominous sign for the housing industry as affordability and limited supply continue to dishearten would-be home buyers.
Leading Economic Indicator (LEI) Index: The Conference Board released LEI rose .4% to 111.2 for the month of Au-gust. Negative contributions from building permits and weekly hours in manufacturing were more than offset by wide-spread positive readings from the other components including a large increase from the Institute of Supply Management (ISM) New Orders Index. According to Ataman Ozyildirim, Director of Business Cycles and Growth Research at The Conference Board, “The leading indicators are consistent with a solid growth scenario in the second half of 2018 and at this stage of a maturing business cycle in the US, it doesn’t get much better than this”. The Coincident and Lagging Economic Indexes for the US both increased .2% for the month of August.
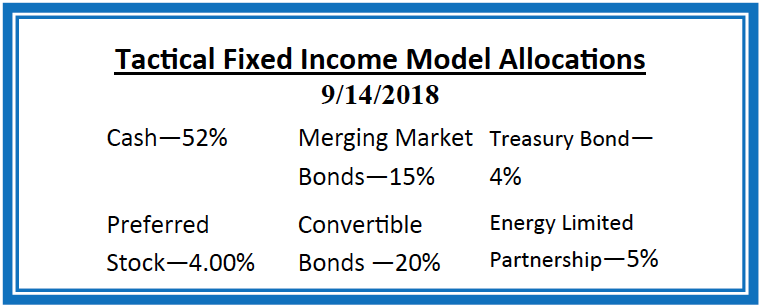
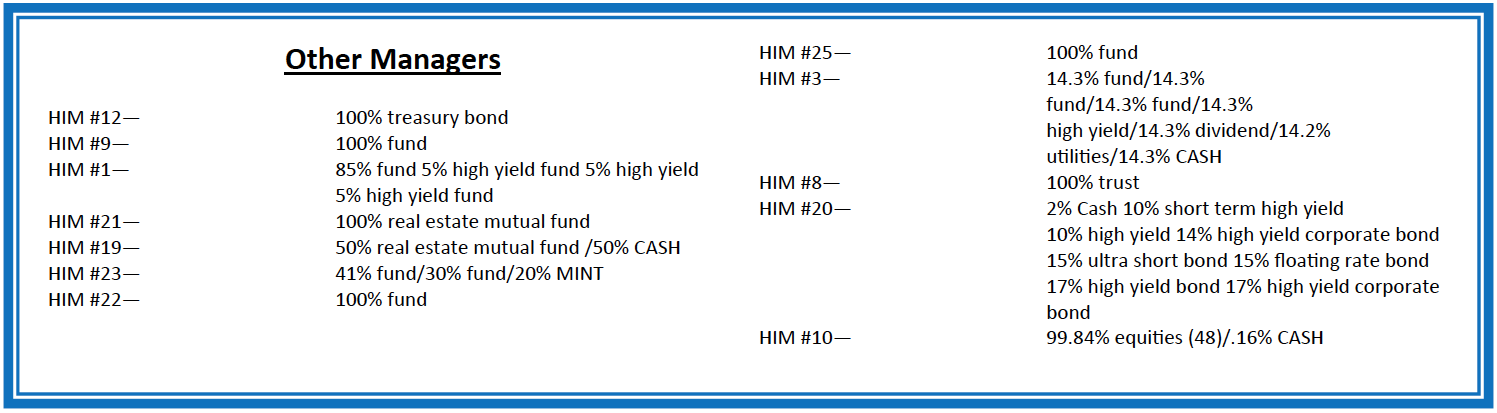
Current Model Allocations
Summary
In utilizing an approach that seeks to limit volatility, it is important to keep perspective of the activity in multiple asset classes. We seek to achieve superior risk-adjusted returns over a full market cycle to a traditional 60% equities / 40% bonds asset allocation. We do this by implementing global mandates of several tactical managers within different risk buckets. For those investors who are unwilling to stomach anything more than minimal downside risk, our goal is to provide a satisfying return over a full market cycle compared to the Barclays Aggregate Bond Index. At Horter Investment Management we realize how confusing the financial markets can be. It is important to keep our clients up to date on what it all means, especially with how it relates to our private wealth managers and their models. We are now in year nine of the most recent bull market, one of
the longest bull markets in U.S. history. At this late stage of the market cycle, it is extremely common for hedged managers to underperform, as they are seeking to limit risk. While none of us know when a market correction will come, even though the movement and volatility sure are starting to act like a correction, our managers have been hired based on our belief that they can accomplish a satisfying return over a full market cycle, — while limiting risk in comparison to a traditional asset allocation approach. At Horter we continue to monitor all of the markets and how our managers are actively managing their portfolios. We remind you there are opportunities to consider with all of our managers. Hopefully this recent market commentary is helpful and thanks for your continued trust and loyalty.