HORTER INVESTMENT MANAGEMENT, LLC
Weekly Commentary horterinvestment.com September 10, 2018
The Bull Stampedes On
As we all know, a great party can be very hard to leave. It’s easy to get caught up in the moment and focus only on a set of positive outcomes rather than the painful morning after. In the case of the stock market, prices are once again soaring to all-time highs, and from what we hear, investors are blithely chasing high returns and reaching for yield. This month’s message is addressed specifically to that mindset because a strong argument can be made that the stock market has entered the mature phase of this bull cycle.
At times like these, when some investors may be tempted to try their luck on making a quick buck on the latest hot stock, it is equally important to consider the potential risk involved. A big key to long-term investment success is avoiding excessive risk – especially late in a market cycle. Knowing when to step aside and walk away early is usually far less painful than trying to exit after the downturn has begun.
As of August 31st, the current secular bull market has now gone 3,461 days since the March 9th 2009 low without a 20% correction in the S&P 500 Index. This surpasses the previous record bull run
that encompassed the period October 1990 through March 2000. While this is not the strongest bull market in history in terms of percentage gain, it has generated the third largest total return since the 1930’s.
It’s important to note that history’s longest bull markets have frequently been followed by some of its most painful bear markets. The bull market of the 1920’s was followed by a bear market in excess of 80% that ushered in the Great Depression. The long bull market in the mid-1930’s was followed by a -47.26% decline spanning 1937 to 1942. Another long bull market in the 1950’s was followed by the Cuban Missile Crisis bear market of 1962 which shaved -26.95% off the Dow. In more modern times, the record bull run from the early 1988 low (post 1987 crash low) to the major highs in early 2000 was followed by the technology bear market which lopped off 50% from the major averages in two years. Bottom line, when prices have moved in one direction over a very long period of time, the inevitable countermove tends to be pronounced and frightening.
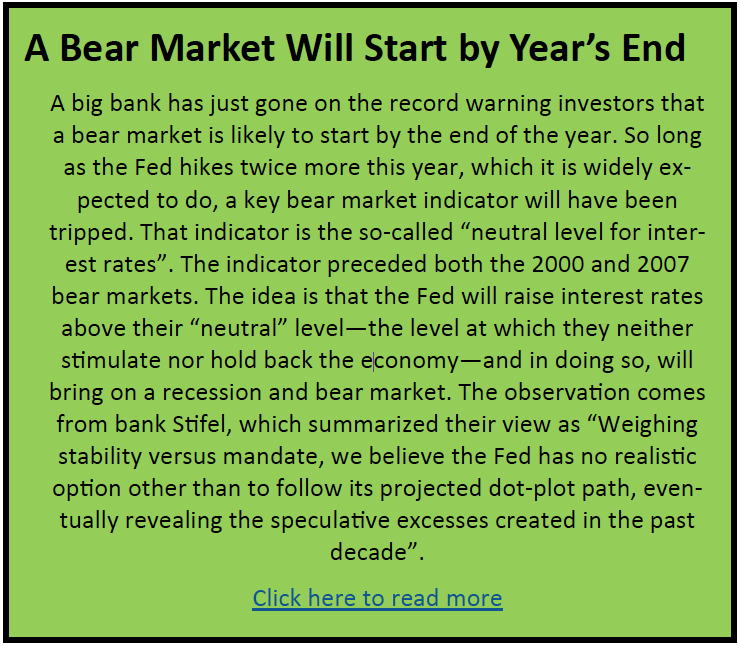
Turning to today’s market, there are a large number of valuation metrics which point to the potential for a serious downside reversal, although precise timing is hard to predict. Price-to-Sales, Market Cap to GDP, Tobin-Q Ratio and many other measures all suggest that stock prices are in relatively rarified territory. In the chart below, the equity market is compared to the price of a median new home. This ratio is now at a level that has only been seen on five prior occasions going back to 1895. The ensuing five bear markets that followed were severe and lasted for several years.

Taking a comprehensive look at the overall current stock market
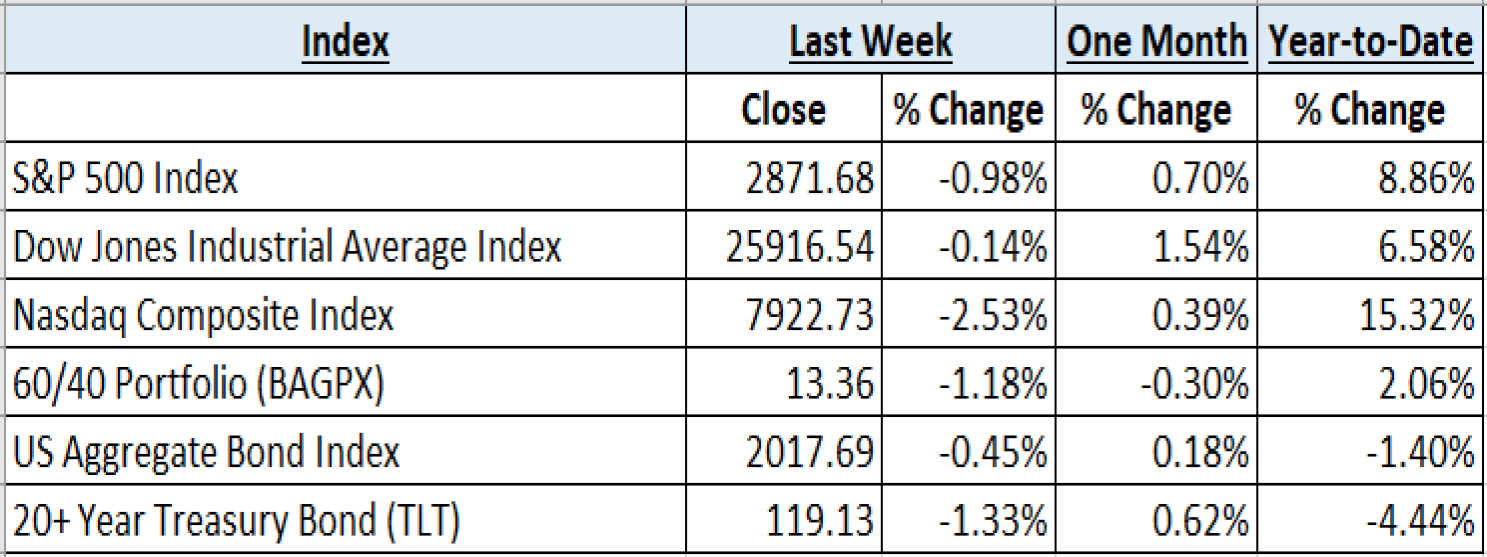
Taking a comprehensive look at the overall current stock market, you can see the chart below representing eight major indices and their returns through the week ending September 7, 2018. In a truly diversified portfolio, the portfolio’s total return is determined by the performance of all of the individual positions in combination – not individually.
So, understanding the combined overall performance of the indices below, simply average the 6 indices to get a better overall picture of the market. The combined average of all 6 indices is 4.50% year to date.
Data Source: Investors FastTrack, Yahoo Finance, Investopedia
Past performance is not a guarantee of future results. This Update is limited to the dissemination of general information pertaining to its investment advisory services and is not suitable for everyone. The information contained herein should not be construed as personalized investment advice. There is no guarantee that the views and opinions expressed in this newsletter will come to pass. Investing in the stock and bond markets involves gains and losses and may not be suitable for all investors. Information presented herein is subject to change without notice. Horter has experienced periods of underperformance in the past and may also in the future. The returns represented herein are total return inclusive of reinvesting all interest and dividends.
The above equity, bond and cash weightings are targets and may not be the exact current weightings in any particular client account. Specifically, there may be cases where accounts hold higher cash levels than stated in these target weightings. This is usually to accommodate account level activity. Furthermore, some variable annuity and variable universal life accounts may not be able to purchase the exact weightings that we are indicating above due to specific product restrictions, limitations, riders, etc. Please refer to your client accounts for more specifics or call your Horter Investment Management, LLC at (513) 984-9933.
Investment advisory services offered through Horter Investment Management, LLC, a SEC-Registered Investment Advisor. Horter Investment Management does not provide legal or tax advice. Investment Advisor Representatives of Horter Investment Management may only conduct business with residents of the states and jurisdictions in which they are properly registered or exempt from registration requirements. Insurance and annuity products are sold separately through Horter Financial Strategies, LLC. Securities transactions for Horter Investment Management clients are placed through TCA by E*TRADE, TD Ameritrade and Nationwide Advisory Solutions.
For additional information about Horter Investment Management, LLC, including fees and services, send for our disclosure statement as set forth on Form ADV from Horter Investment Management, LLC using the contact information herein. Please read the disclosure statement carefully before you invest or send money.
Dow Jones – Week Ending
WEEKLY MARKET SUMMARY
Global Equities: After two consecutive weeks of recording new all-time highs, equity markets skittishly welcomed traders back from the Labor Day holiday with volatility and uncertainty. While market participants waited in vain for clarification on the trade war escalation and tariffs on another $200 billion of Chinese goods, executives from major technology companies fielded questions on Capitol Hill which led to Wall Street’s hottest sector taking a hit. The Technology sector’s SPDR Select ETF (XLK) fell nearly 2.7% and led to the Nasdaq Composite dropping 2.4% during weekly trading. The Dow Jones Industrial Average and the S&P 500 fared relatively well, only losing around .17% and 1%, respectively. Continued strong US economic data lifted the US dollar, which led to International equities again taking a hit, with emerging markets and the iShares MSCI Emerging Markets Index ETF (EEM) losing around 3.85%, while International Developed markets represented by the iShares MSCI EAFE Index Fund ETF (EFA) was down 2.9% for the week.
Fixed Income: The robust US economic data starting with Tuesday’s ISM survey, and continuing with the Employment Situation report on Friday, led to the yield on the 10 Year US Treasury rising back above 2.9%, and ending the week near 2.94%. Any dovish sentiment that markets were picking up from the Fed went out the window with the rising wage data included in the Employment Report. High yield spreads widened slightly during the week, as Lipper reported net outflows for both corporate investment grade and high yield funds of $297 million and $639 million, respectively, for the week ended September 5th.
Commodities: Oil prices fell during the week, as the summer driving season has officially come to an end, and Hurricane Gordon was largely a non-event in the Gulf of Mexico. Risks of continued emerging market contagion have also continued to weigh on commodity markets. The American oil benchmark, West Texas Intermediate (WTI) fell over 2.75% during the week, to $67.84 per barrel, while the International Brent crude benchmark dropped less than .5%, as supply from Iran remains unclear. Natural gas prices fell over 4% during the week, to $2.78/MMBtu.
WEEKLY ECONOMIC SUMMARY
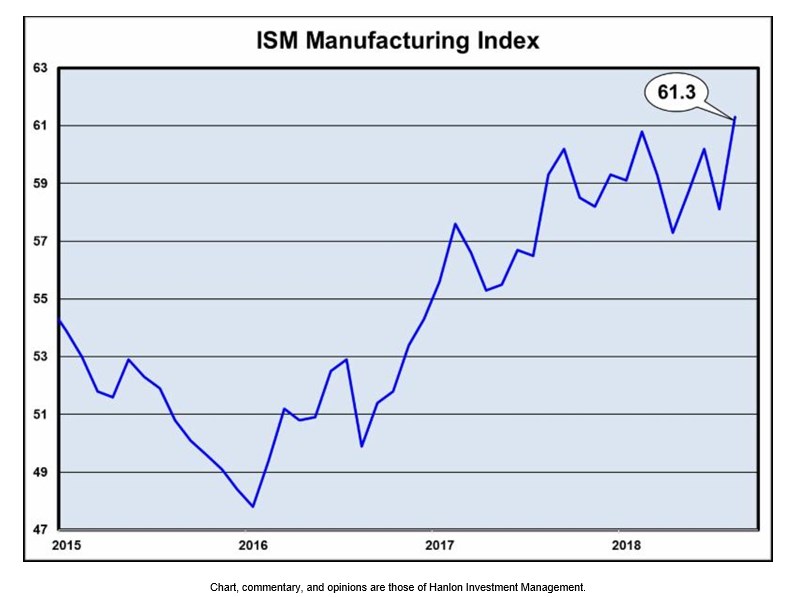
Institute for Supply Management’s (ISM) Surveys: The ISM surveys of economic activity in the US manufacturing and non-manufacturing sectors continue to signal strength by beating consensus estimates, which may be difficult to maintain, going forward. However, the ISM Manufacturing Index has registered its highest level since 2004 and is also our Chart of the Week (below). The survey’s measure for new orders, an important factor in the Conference Board’s Leading Economic Indicators, surged 4.9% over the July reading and continues to signal solid demand. Both surveys indicated continued upward pricing pressure, although at a declining rate, with survey participants often citing tariffs and the trade war as the culprit.
International Trade: President Trump was no doubt disappointed with Wednesday’s US Census Bureau report on International Trade that showed a significant 9.5% widening of the US trade deficit to $50.1 billion (B), for the month of July. As expected with a strengthening currency, exports of $211.1B fell $2.1B from the prior month, while imports increased $2.2B to $261.2B. Third quarter GDP is fighting an uphill battle with these numbers, as the US trade deficit in goods increased and the US trade surplus in services dropped.
Employment Situation: A better-than-expected non-farm payrolls number of 201,000 headlined the Bureau of Labor Statistics Employment Situation report for the month of August. A decline of manufacturing jobs was dwarfed by cumulative increases in the construction, trade and transportation, and professional services industries. Tight labor conditions are once again apparent with the unemployment rate remaining at 3.9%, but this time with average hourly earnings coming in higher than consensus estimates. The month-on-month increase of .4% was a surprise, but the 2.9% year-on-year increase has not been seen since 2009, and likely keeps the Federal Reserve Open Market Committee on track to raise the benchmark interest rate twice more this year.
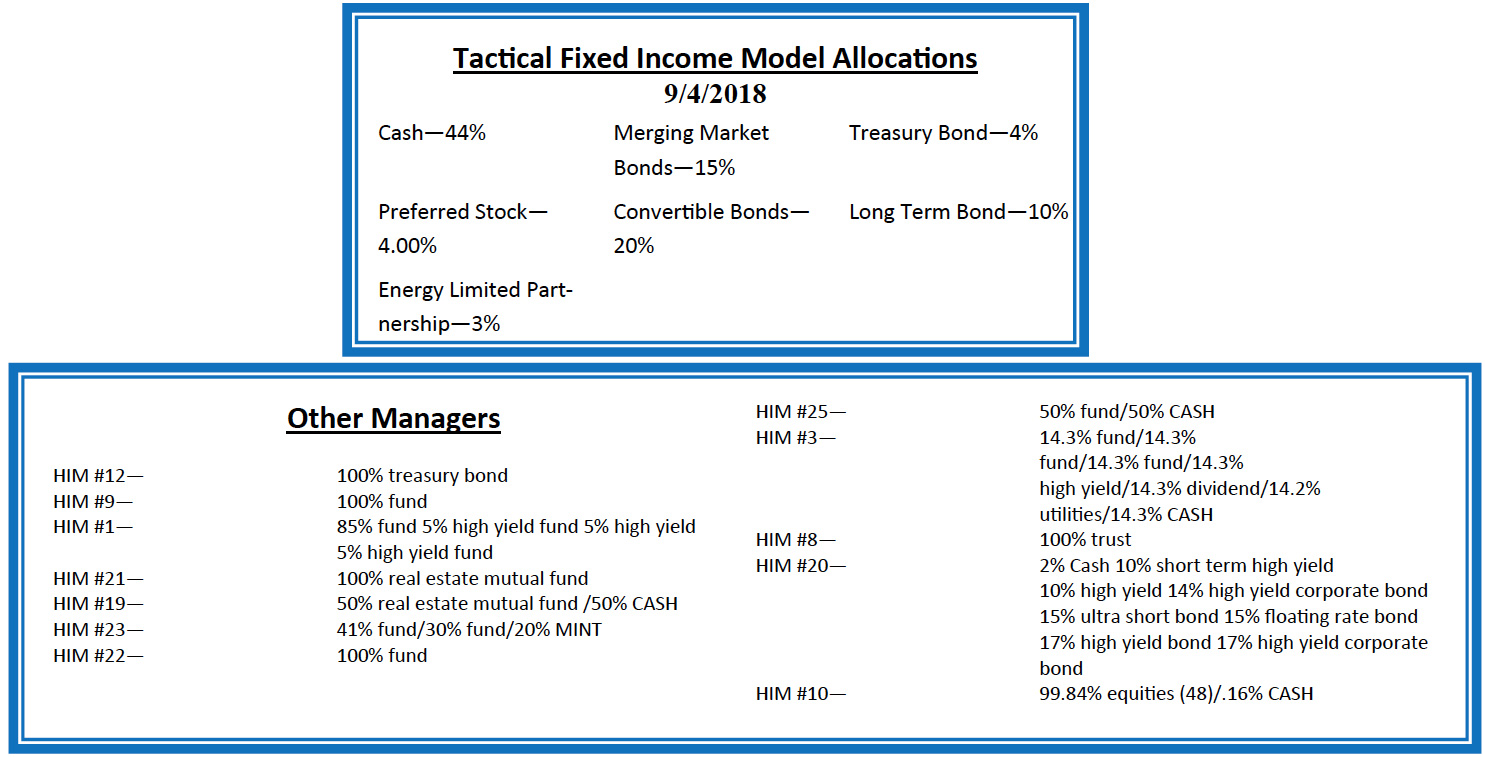
Current Model Allocations
Summary
In utilizing an approach that seeks to limit volatility, it is important to keep perspective of the activity in multiple asset classes. We seek to achieve superior risk-adjusted returns over a full market cycle to a traditional 60% equities / 40% bonds asset allocation. We do this by implementing global mandates of several tactical managers within different risk buckets. For those investors who are unwilling to stomach anything more than minimal downside risk, our goal is to provide a satisfying return over a full market cycle compared to the Barclays Aggregate Bond Index. At Horter Investment Management we realize how confusing the financial markets can be. It is important to keep our clients up to date on what it all means, especially with how it relates to our private wealth managers and their models. We are now in year nine of the most recent bull market, one of
the longest bull markets in U.S. history. At this late stage of the market cycle, it is extremely common for hedged managers to underperform, as they are seeking to limit risk. While none of us know when a market correction will come, even though the movement and volatility sure are starting to act like a correction, our managers have been hired based on our belief that they can accomplish a satisfying return over a full market cycle, — while limiting risk in comparison to a traditional asset allocation approach. At Horter we continue to monitor all of the markets and how our managers are actively managing their portfolios. We remind you there are opportunities to consider with all of our managers. Hopefully this recent market commentary is helpful and thanks for your continued trust and loyalty.