HORTER INVESTMENT MANAGEMENT, LLC
Weekly Commentary horterinvestment.com October 1, 2018
How the Bull Market Could Ruin Retirement
That is quite a counterintuitive headline, but in an odd way, it could not be more true. Bloomberg has put out a piece, which echoes many advisors, that the current bull market could actually end up hurting many retirees. The reason why is that many have experienced hefty gains in the last decade and feel comfortable re-tiring. However, after such a sharp run higher, the mar-ket is likely to experience a steep correction. For retirees seeking to steadily withdraw money from their ac-counts, this could pose a major problem, as a drop in the market could cause such significant damage to portfolio value that even outperformance in subsequent years may not make up for it.


Confidence is a Big Problem for the Stock Market
Consumer confidence in the United States is at an 18-year high. The last time Americans registered a feeling of confidence this high was in September 2000. However, that could be a big problem for the stock market. Con-sumer confidence can prove a counter-indicator. The highest ever reading for the measure was recorded in May 2000, just before the Dotcom crash. Small business confidence is even higher, running at a 45-year peak. Ac-cording to one analyst, “[To] any market historian, that does not guarantee a low-risk market, or another big bull market leg on the horizon”.

Taking a comprehensive look at the overall current stock market
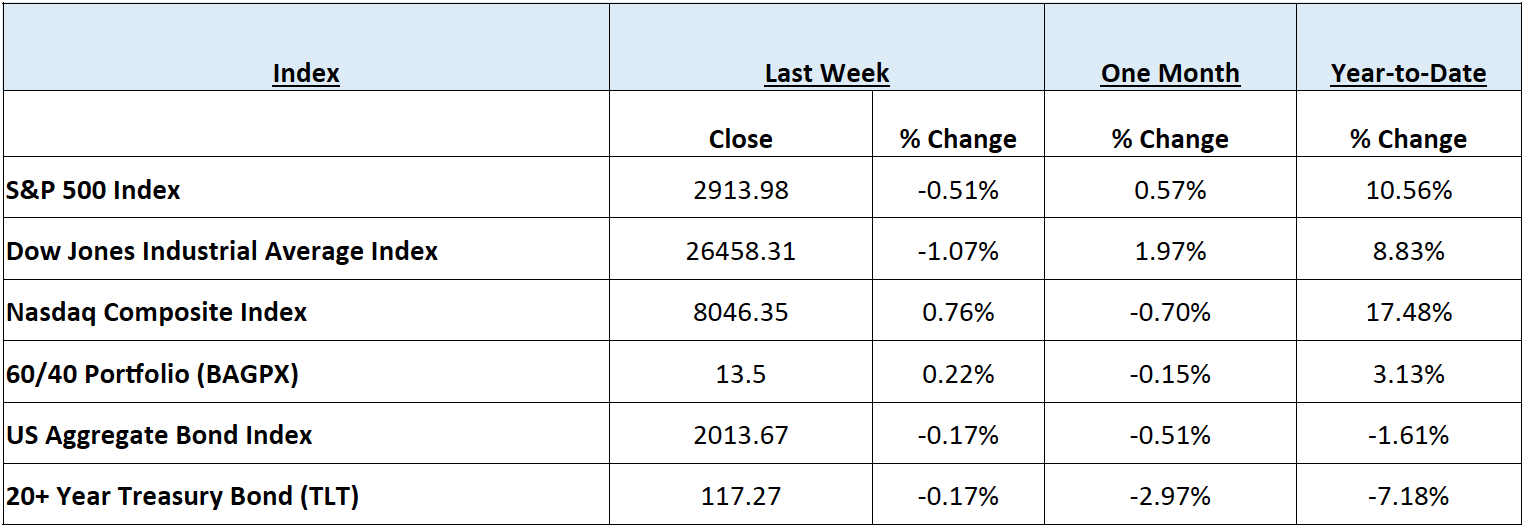
Taking a comprehensive look at the overall current stock market, you can see the chart below representing eight major indices and their returns through the week ending September 28, 2018. In a truly diversified portfolio, the portfolio’s total return is determined by the performance of all of the individual positions in combination – not individually.
So, understanding the combined overall performance of the indices below, simply average the 6 indices to get a better overall picture of the market. The combined average of all 6 indices is 5.20% year to date.
Data Source: Investors FastTrack, Yahoo Finance, Investopedia
Past performance is not a guarantee of future results. This Update is limited to the dissemination of general information pertaining to its investment advisory services and is not suitable for everyone. The information contained herein should not be construed as personalized investment advice. There is no guarantee that the views and opinions expressed in this newsletter will come to pass. Investing in the stock and bond markets involves gains and losses and may not be suitable for all investors. Information presented herein is subject to change without notice. Horter has experienced periods of underperformance in the past and may also in the future. The returns represented herein are total return inclusive of reinvesting all interest and dividends.
The above equity, bond and cash weightings are targets and may not be the exact current weightings in any particular client account. Specifically, there may be cases where accounts hold higher cash levels than stated in these target weightings. This is usually to accommodate account level activity. Furthermore, some variable annuity and variable universal life accounts may not be able to purchase the exact weightings that we are indicating above due to specific product restrictions, limitations, riders, etc. Please refer to your client accounts for more specifics or call your Horter Investment Management, LLC at (513) 984-9933.
Investment advisory services offered through Horter Investment Management, LLC, a SEC-Registered Investment Advisor. Horter Investment Management does not provide legal or tax advice. Investment Advisor Representatives of Horter Investment Management may only conduct business with residents of the states and jurisdictions in which they are properly registered or exempt from registration requirements. Insurance and annuity products are sold separately through Horter Financial Strategies, LLC. Securities transactions for Horter Investment Management clients are placed through TCA by E*TRADE, TD Ameritrade and Nationwide Advisory Solutions.
For additional information about Horter Investment Management, LLC, including fees and services, send for our disclosure statement as set forth on Form ADV from Horter Investment Management, LLC using the contact information herein. Please read the disclosure statement carefully before you invest or send money.
Dow Jones – Week Ending
WEEKLY MARKET SUMMARY
Global Equities: Major US equity indices closed out the 3rd quarter mixed, with a bit of a whimper, as politics took center stage foreshadowing the mid-term battles to come. The Nasdaq Composite Index led the major US indices, gaining around .65% during the week as FAANG stocks outperformed the broader market. The Dow Jones Industrial Average ended the week down slightly over 1%, and a week removed from its all-time closing high. Energy stocks and the SPDR Select Energy ETF (XLE) outlasted the new Communication Services sector to lead all S&P 500 Index sectors with a 1% gain for the week. The cyclical Materials sector trailed all other major sectors thanks in part to an analyst downgrade of Dow DuPont Inc (DWDP). International equities were led lower by International Developed markets represented by the iShares MSCI EAFE Index Fund ETF (EFA) thanks to fresh US dollar strength and renewed concerns surrounding budget proposals in Italy.
Fixed Income: The yield on the 10 Year US Treasury again tested resistance level near 3.10% before ultimately reversing after anticipated action from the Federal Reserve Open Market Committee (FOMC), and finishing just under 3.05%, this week. The 10 year versus 2 year Treasury yield spread came off of the recent wide, closing the week near .233%, hurting financial stocks in the process. High yield bond spreads were steady for the week, while Lipper reported net outflows of $1.569 billion for high yield bond funds for the week ended September 26th.
Commodities: Oil prices increased again this week, as OPEC announced that they would not be taking further action to increase supply due to the tightening of supply from Iran. The Joint OPEC and Non-OPEC committee expressed satisfaction that supply and demand are in a healthy equilibrium. Both major oil benchmarks ended the week higher, with the American West Texas Intermediate (WTI) gaining over 3.5%, up to $73.48 per barrel, while the International Brent crude benchmark gained over 5%, closing out near $82.72 per barrel. Natural gas prices also traded higher during the week, up to $3.01/MMBtu.
WEEKLY ECONOMIC SUMMARY
Gross Domestic Product (GDP): The third and final estimate for 2nd quarter (Q2) US GDP was released on Thursday, and was unchanged from the prior estimate at an annualized quarter-on-quarter (QoQ) growth rate of 4.2%. Incremental increases from non-residential fixed investment and government purchases offset a small revision of the disappointing reduction in residential investment. Overall, the economy growing at the fastest pace since 2014 thanks to consumer spending is encouraging, though setting a high bar for the second half of the year.
Personal Income & Outlays: Consumer spending was in line with consensus estimates for August, with a .3% month-on-month (MoM) increase, according to the Bureau of Economic Analysis (BEA). Personal income also rose by .3% for the same period, which was slightly below the estimate of .4%. Personal Consumption Expenditures (PCE), a measure of inflation, came in below the consensus range at 2.2% year-on-year (YoY). Core PCE, the favorite measure of inflation for the Federal Reserve (Fed) which excludes food & energy, was in line with the consensus estimate and the Fed’s target, at 2% YoY.
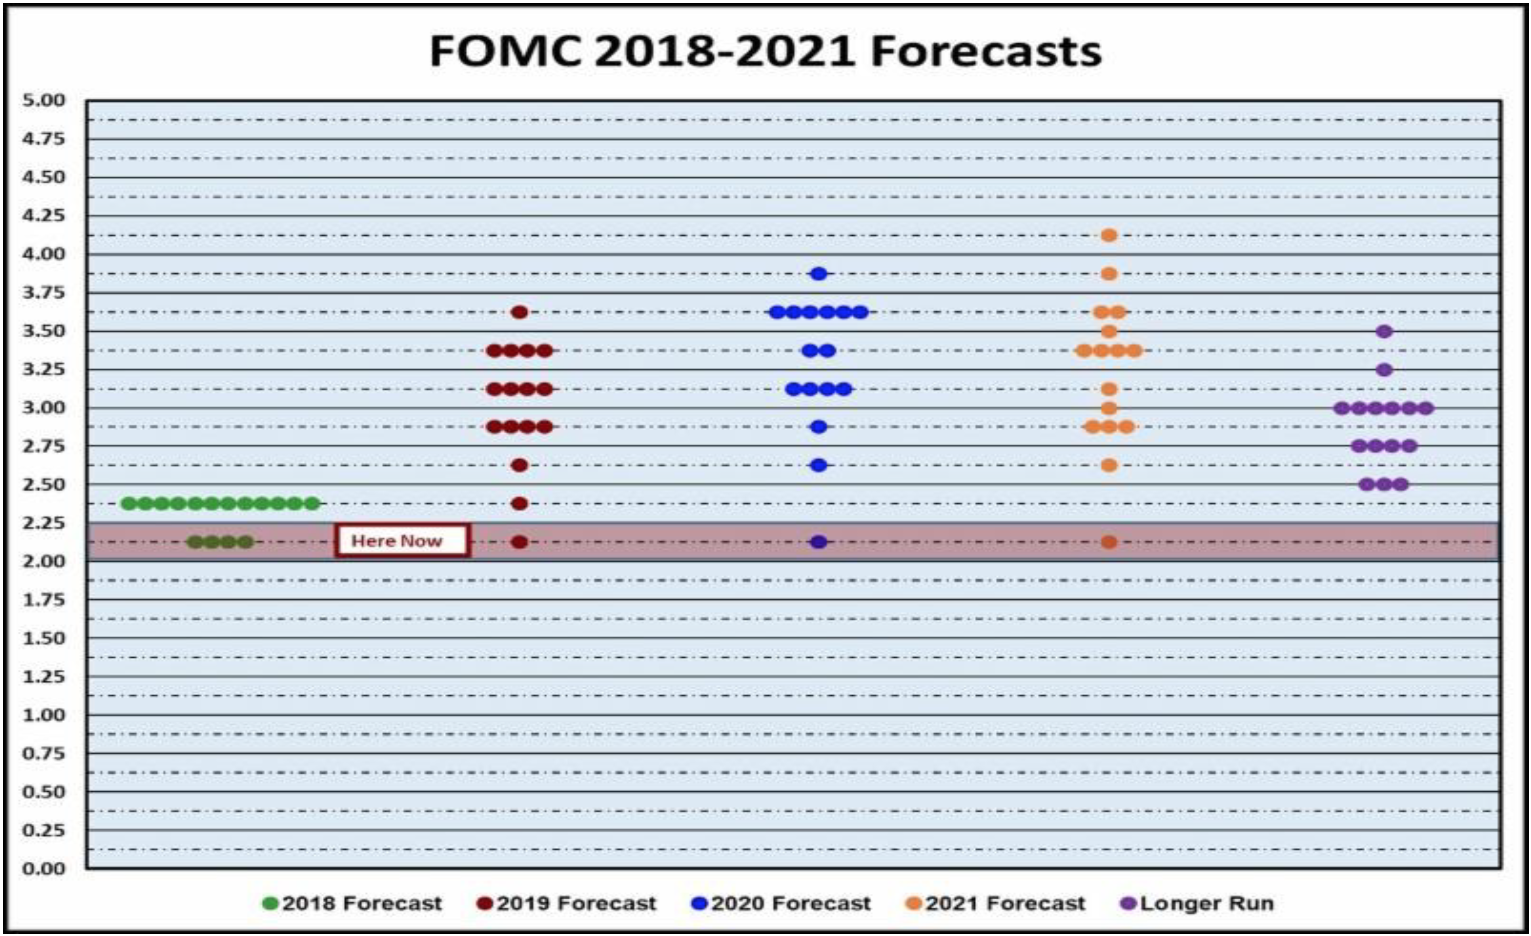
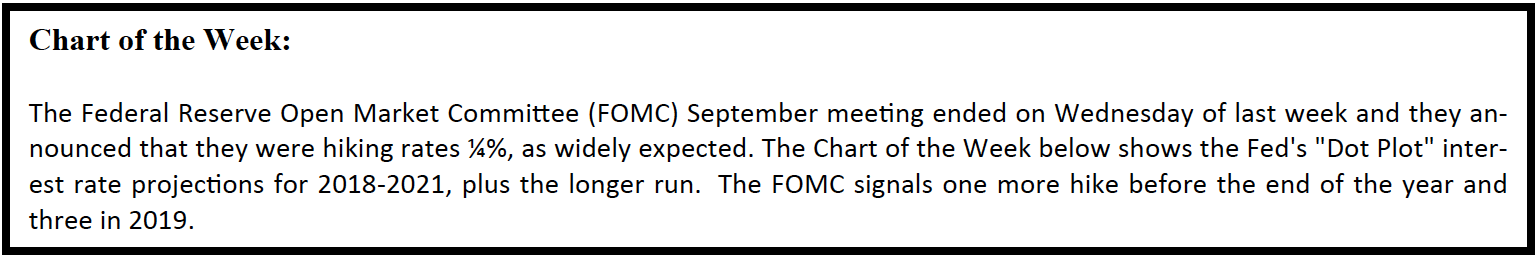
FOMC Announcement: The FOMC boosted its benchmark Federal Funds rate another .25% to a target range of 2-2.25% in a well communicated and widely anticipated move to help moderate future inflationary pressure on the economy. It was an uneventful press conference with Chairman Jerome Powell after the 2-day Fed meeting, where the only major change to the statement was the removal of the word “accommodative” from its current policy. The Chart of the Week (below) indicates the expected path of year-end Fed Funds rates, which now includes estimates for 2021.
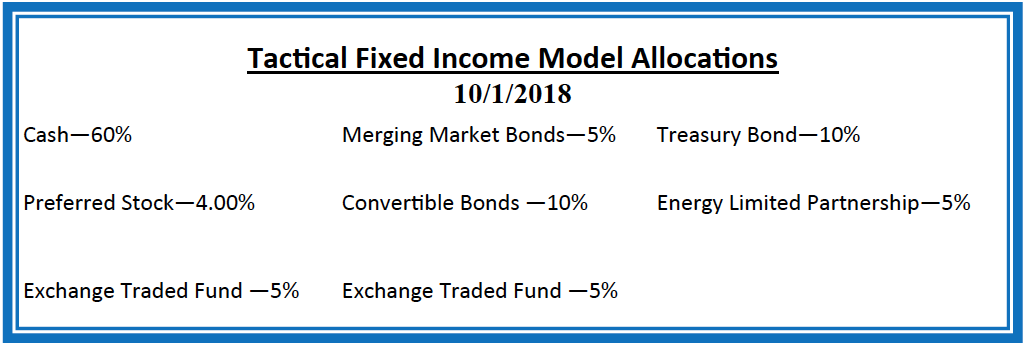
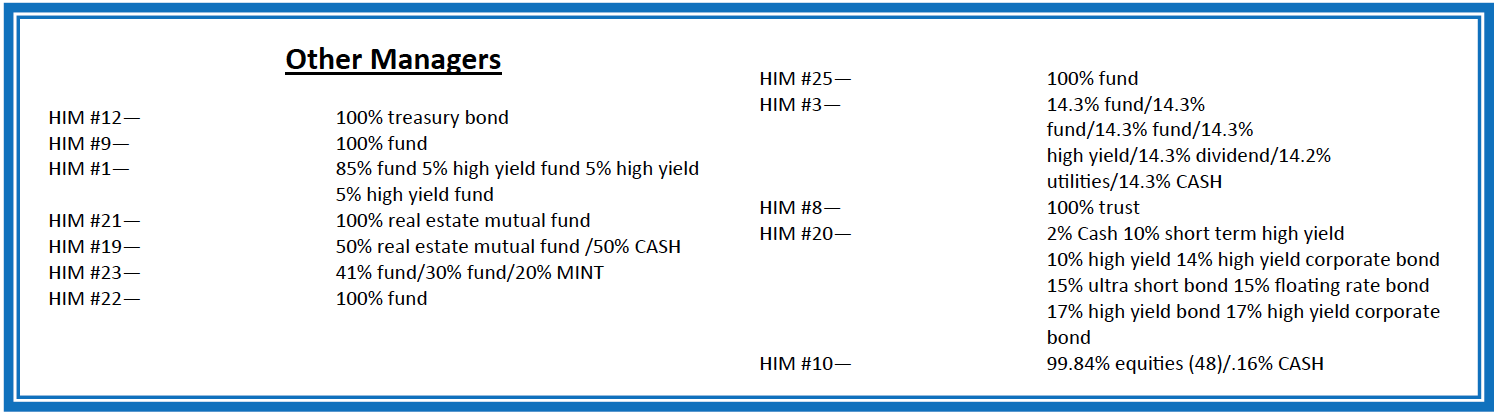
Current Model Allocations
Summary
In utilizing an approach that seeks to limit volatility, it is important to keep perspective of the activity in multiple asset classes. We seek to achieve superior risk-adjusted returns over a full market cycle to a traditional 60% equities / 40% bonds asset allocation. We do this by implementing global mandates of several tactical managers within different risk buckets. For those investors who are unwilling to stomach anything more than minimal downside risk, our goal is to provide a satisfying return over a full market cycle compared to the Barclays Aggregate Bond Index. At Horter Investment Management we realize how confusing the financial markets can be. It is important to keep our clients up to date on what it all means, especially with how it relates to our private wealth managers and their models. We are now in year nine of the most recent bull market, one of
the longest bull markets in U.S. history. At this late stage of the market cycle, it is extremely common for hedged managers to underperform, as they are seeking to limit risk. While none of us know when a market correction will come, even though the movement and volatility sure are starting to act like a correction, our managers have been hired based on our belief that they can accomplish a satisfying return over a full market cycle, — while limiting risk in comparison to a traditional asset allocation approach. At Horter we continue to monitor all of the markets and how our managers are actively managing their portfolios. We remind you there are opportunities to consider with all of our managers. Hopefully this recent market commentary is helpful and thanks for your continued trust and loyalty.