HORTER INVESTMENT MANAGEMENT, LLC
Weekly Commentary horterinvestment.com November 19, 2018
What will cause the next recession? Gary Shilling explains why it could be the Fed
Gary Shilling has made a career out of predicting bubbles. So what are the big risks he sees out in the global economy now?
It’s not necessarily a major shock that could

drive the U.S. into a recession immediately, he says; he’s concerned about emerging market debt.
He also explains that when the Federal Reserve raises interest rates, historically, it usually damages the economy. It’s one of the reasons he’s short stocks right now.
He’s also short bitcoin, which he calls “some sort of a big Ponzi scheme.”
Larry Summers: 50 percent chance of a US recession by 2020
Former Treasury Secretary Larry Summers has put the chances of a U.S. recession at 50 percent within the next two years.
The economist told CNBC’s Joumanna Bercetche on Thursday that a slowdown in growth was a “near certainty” before adding “the recession risk is nearly 50 percent over the next two years, maybe slightly less.”
Summers, who served in Bill Clinton’s administration, said while any economy in expansion has a good chance of reversing course, U.S. growth is likely to be checked by unsettled financial markets, geopolitical tension and the Federal Reserve’s tightening cycle.
The economist has previously criticized President Donald Trump for attempting to influence the Fed’s monetary policy. Trump has expressed concern the Fed could choke off growth by raising interest rates too quickly.
Despite disagreeing with statements from Washington, Summers says the Fed should be careful about raising rates too quickly.
“I think the risks if we have a recession are very, very serious so they need to bend over backward to avoid that,” he said. He added that the Fed could probably afford to let inflation run hot, given the sub-target rate experienced over the previous decade.


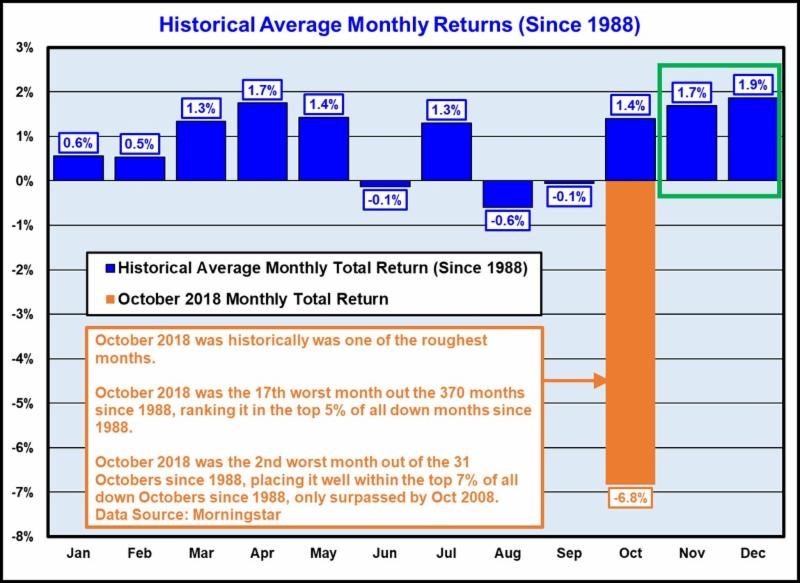
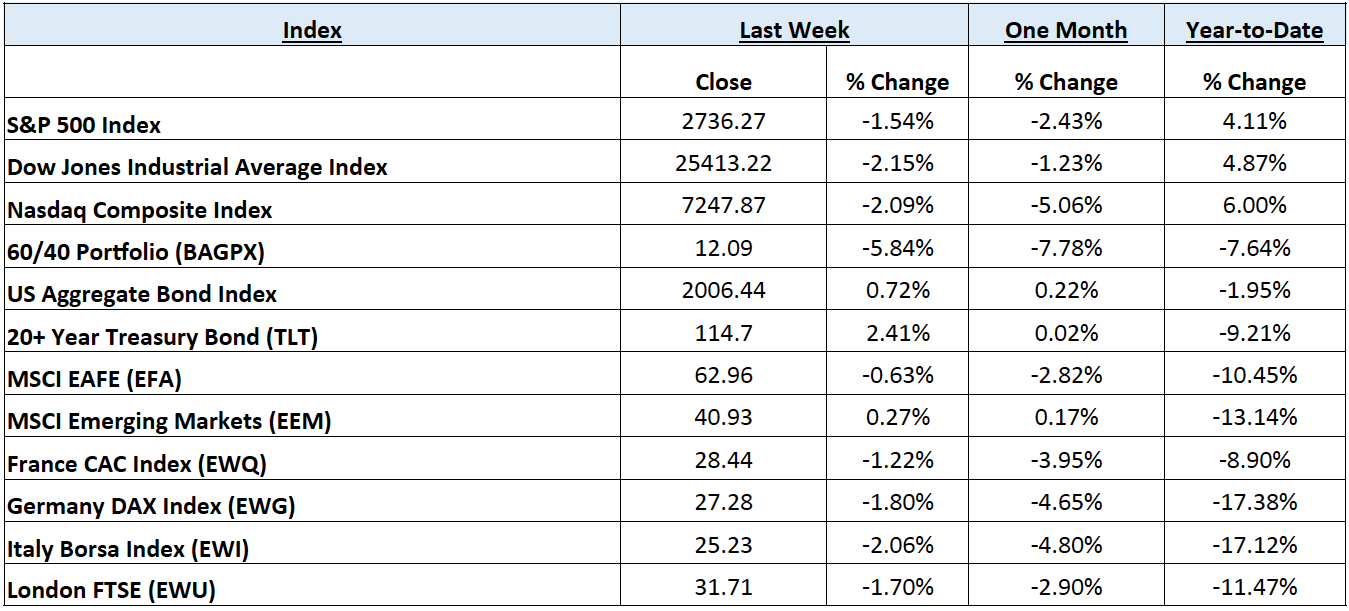
Taking a comprehensive look at the overall current stock market
Taking a comprehensive look at the overall current stock market, you can see the chart below representing eight major indices and their returns through the week ending November 16, 2018. In a truly diversified portfolio, the portfolio’s total return is determined by the performance of all of the individual positions in combination – not individually.
So, understanding the combined overall performance of the indices below, simply average the 12 indices to get a better overall picture of the market. The combined average of all 12 indices is -6.86% year to date.
Data Source: Investors FastTrack, Yahoo Finance, Investopedia

Past performance is not a guarantee of future results. This Update is limited to the dissemination of general information pertaining to its investment advisory services and is not suitable for everyone. The information contained herein should not be construed as personalized investment advice. There is no guarantee that the views and opinions expressed in this newsletter will come to pass. Investing in the stock and bond markets involves gains and losses and may not be suitable for all investors. Information presented herein is subject to change without notice. Horter has experienced periods of underperformance in the past and may also in the future. The returns represented herein are total return inclusive of reinvesting all interest and dividends.
The above equity, bond and cash weightings are targets and may not be the exact current weightings in any particular client account. Specifically, there may be cases where accounts hold higher cash levels than stated in these target weightings. This is usually to accommodate account level activity. Furthermore, some variable annuity and variable universal life accounts may not be able to purchase the exact weightings that we are indicating above due to specific product restrictions, limitations, riders, etc. Please refer to your client accounts for more specifics or call your Horter Investment Management, LLC at (513) 984-9933.
Investment advisory services offered through Horter Investment Management, LLC, a SEC-Registered Investment Advisor. Horter Investment Management does not provide legal or tax advice. Investment Advisor Representatives of Horter Investment Management may only conduct business with residents of the states and jurisdictions in which they are properly registered or exempt from registration requirements. Insurance and annuity products are sold separately through Horter Financial Strategies, LLC. Securities transactions for Horter Investment Management clients are placed through TCA by E*TRADE, TD Ameritrade and Nationwide Advisory Solutions.
For additional information about Horter Investment Management, LLC, including fees and services, send for our disclosure statement as set forth on Form ADV from Horter Investment Management, LLC using the contact information herein. Please read the disclosure statement carefully before you invest or send money.
Dow Jones – Week Ending
WEEKLY MARKET SUMMARY
Global Equities: Broad US equities ended on the downside after news headlines triggered a volatile week of trading for bonds and commodities as well. The continued decline of oil prices combined with the ongoing Brexit and China/US trade sagas added to the uncertainty on the outlook for global growth. US equities fought back after hitting their lows on Thursday morning, but the Dow Jones Industrial Average still lost -2.19% on the week, while the S&P 500 Index outperformed on a relative basis, down -1.58%. The defensive sectors outperformed, as the Select Sector Real Estate SPDR ETF (XLRE) led all major sectors for the week with a gain of nearly 1%. The Select Sector Consumer Discretionary SPDR ETF (XLY) led all major sectors to the downside, down -3.32%. International equities relatively outperformed their US counterparts, as International Developed equities and the iShares MSCI EAFE Index ETF (EFA) lost -.7%, while Emerging Market equities represented by the iShares MSCI Emerging Market Index ETF (EEM) gained 2.8% on the week.
Fixed Income: A shortened week for bond trading in observance of Veterans Day was no less eventful, as US interest rates held up during the equity market sell-off on Tuesday and Wednesday. It wasn’t until Federal Reserve Chair Jerome Powell, while speaking at an event in Dallas, spoke about possible challenges to growth in 2019 rising from slowing demand abroad, fading effects of fiscal stimulus, and lagged economic impact of past rate increases. The comments were interpreted by markets to be “dovish” signaling that future interest rate hikes may be paused, which helped turn the tide for falling equity markets and falling bond prices, as the yield on the 10-year US Treasury Bond fell from 3.18% last week to below 3.07%. Concerns surrounding corporate debt loads led to high yield bond spreads over equivalent Treasury securities to widen to 2-year highs of over 4%.
Commodities: Oil prices fell drastically as increased production and lowered demand projections were exacerbated by the unwinding of speculative positioning in energy markets by Commodity Trading Advisors (CTAs). Crude prices eventually found support mid-week, with the American West Texas Intermediate (WTI) benchmark bouncing somewhat off $55 per barrel, closing the week at $56.84. The International Brent crude benchmark was equally bruised, finishing the week at $66.98 per barrel. Natural gas found itself on the other side of the energy trade, getting “short squeezed” higher near $5/MMBtu mid-week before ending the week up 17%, at $4.37/MMBtu.
WEEKLY ECONOMIC SUMMARY
Consumer Price Index (CPI): The CPI, an inflation measure released by The Bureau of Labor Statistics, records the average price level change of a fixed basket of goods and services purchased by consumers. October’s release was in line with consensus estimates, increasing .3% month-on-month (MoM) and 2.5% on a year-on-year (YoY) basis, thanks mostly to rising energy and gasoline prices felt during the month. The precipitous decline in oil prices should remove pressure from high energy prices in November’s report, and help bolster consumption heading into the holiday season. The Core CPI, which removes changes for food and energy, was also in line with consensus at .2% MoM and 2.1% YoY as prices for shelter, medical care, and recreation all remained fairly subdued.
Retail Sales: The latest retail sales data released by the US Census Bureau was much better than expected, at a .8% MoM increase for the month of October with auto sales bouncing back by 1.1% after months of weakness. An increase for building materials is also a welcome development from this report, as housing markets could use a boost in the form of new residential investment. An area of concern, however, are slumping restaurant sales for the past few months which may signal softening consumer confidence.
3rd Quarter Earnings: Continuing with the theme of consumers, it was a big week for retail earnings as Macy’s (M), Walmart (WMT), JC Penney’s (JCP), and Nordstrom (JWN) reported 3rd quarter earnings. All four companies beat earnings estimates, but only beleaguered JCP stock ended the week above the pre-earnings release market price thanks to relatively disappointing guidance for f-ture earnings and margins. With over 93% of the S&P 500 having reported Q3 earnings, the forward price to earnings (P/E) ratios based on full-year 2019 expected earnings are 10.5 for Emerging Markets (MSCI EM IMI), 12.33 for Developed International (MSCI EAFE), and 17.1 for the S&P 500.
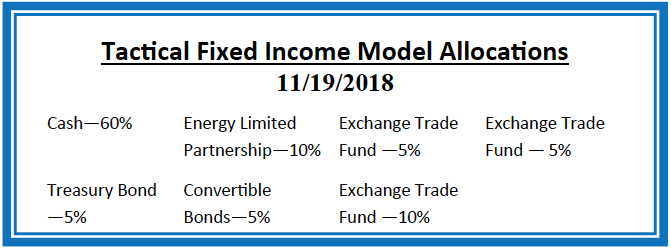
Current Model Allocations

Summary
In utilizing an approach that seeks to limit volatility, it is important to keep perspective of the activity in multiple asset classes. We seek to achieve superior risk-adjusted returns over a full market cycle to a traditional 60% equities / 40% bonds asset allocation. We do this by implementing global mandates of several tactical managers within different risk buckets. For those investors who are unwilling to stomach anything more than minimal downside risk, our goal is to provide a satisfying return over a full market cycle compared to the Barclays Aggregate Bond Index. At Horter Investment Management we realize how confusing the financial markets can be. It is important to keep our clients up to date on what it all means, especially with how it relates to our private wealth managers and their mod-els. We are now in year nine of the most recent bull market, one of
the longest bull markets in U.S. history. At this late stage of the market cycle, it is extremely common for hedged managers to underperform, as they are seeking to limit risk. While none of us know when a market correction will come, even though the movement and volatility sure are starting to act like a correction, our managers have been hired based on our belief that they can accomplish a satisfying return over a full market cycle, — while limiting risk in comparison to a traditional asset allocation approach. At Horter we continue to monitor all of the markets and how our managers are actively managing their portfolios. We remind you there are opportunities to consider with all of our managers. Hopefully this recent market commentary is helpful and thanks for your continued trust and loyalty.