HORTER INVESTMENT MANAGEMENT, LLC
Weekly Commentary horterinvestment.com November 12, 2018
Forecasting the Next Recession: The Yield Curve Doesn’t Lie
Using the yield curve as a recession signal is not something we invented— its predictive ability has been known and extensively studied for decades. Despite its strong track record, however, the signal from the recent flattening of the yield curve has been dismissed by many in the market, and by many policymakers at the Fed.
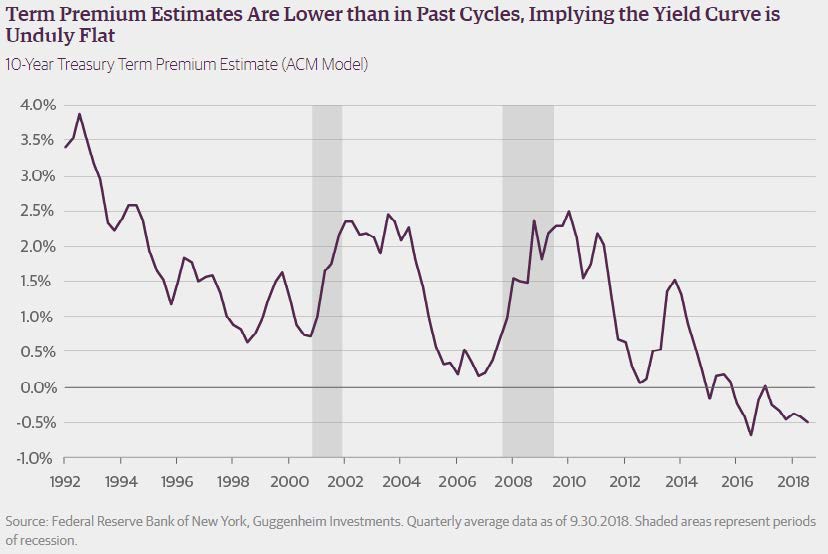
The most prominent argument made for why the signal from the yield curve is not valid this time around is that QE programs from both the Fed and foreign central banks have held down long-term interest rates and caused the yield curve to be unduly flat. As supporting evidence, the naysayers point to econometric model estimates showing that term premiums—the excess return investors can expect to earn from buying a longer maturity, fixed-rate bond instead of rolling a sequence of short-term positions over the same horizon—are not only lower than in past cycles, but are in fact negative. We see several flaws in these arguments.
Term premiums are not as low as the Fed’s models say: Because term premiums cannot be observed, investors must rely on model estimates to gauge the duration risk premiums embedded in Treasury securities. One of the most frequently cited is the Adrian, Crump, and Moench (ACM) model, which is published by the Federal Reserve Bank of New York (New York Fed). In the New York Fed’s models, term premium is defined as the observed level of 10-year Treasury yields minus the estimate of the “risk-neutral yield,” which is an estimate of the average short-term rate expected to
prevail over 10 years. The ACM model currently indicates that 10-year term premiums are -35 basis points, roughly 85 basis points below where they were in mid-2005, one year before the end of the last Fed tightening cycle. This would seem to corroborate research suggesting that the Fed’s asset purchase programs cumulatively depressed 10-year term premiums by over 100 basis points (this effect would have faded somewhat in recent years).
Fed unwavering in message that interest rates will keep going higher
The Federal Reserve made clear it sees a near perfect environment to keep raising interest rates and that it was undeterred by recent market volatility.
Strategists viewed the Fed’s post-meeting statement Thursday as slightly hawkish, which means in favor of higher rates. Treasury yields were slightly firmer. The 2-year Treasury note, which most reflects Fed policy, rose slightly, briefly touching a new decade high of 2.97 percent. Stocks waffled after the Fed statement and then moved lower.
”[Fed officials] seem pretty content. No big changes. It’s just more evidence that rates are going up,” said Michael Schumacher, director rates strategy at Wells Fargo.
Strategists expect the Fed to raise interest rates by a quarter point in December, but after that there is a lack of consensus. The Fed forecasts three more rate hikes next year. Some market pros worry that the economy may slow down toward the end of next year, or
that the Fed’s tightening will slow growth and that could force the Fed to slow down its rate hiking.
The Fed Thursday left the fed funds rate range unchanged at 2 per-cent to 2.25 percent, while making just a slight adjustment in its post-meeting statement. Its comments on the economy were fairly balanced, as it noted household spending continued to grow strong-ly, but that business fixed investment moderated from a strong level earlier in the year.
The Fed said it expects “further gradual increases” in the target range for the federal funds rate and that will depend on continued economic expansion, strong labor conditions and inflation near its 2 percent target. The Fed also indicated it does not expect to be pushed to raise rates by inflation, noting inflation looks set to re-main near 2 percent for the next 12 months.

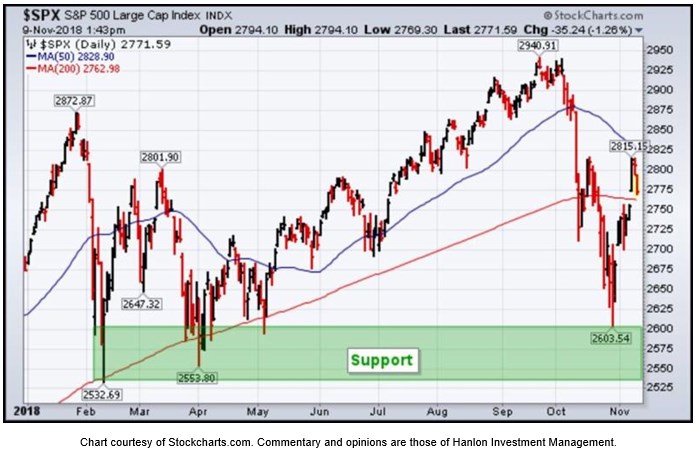
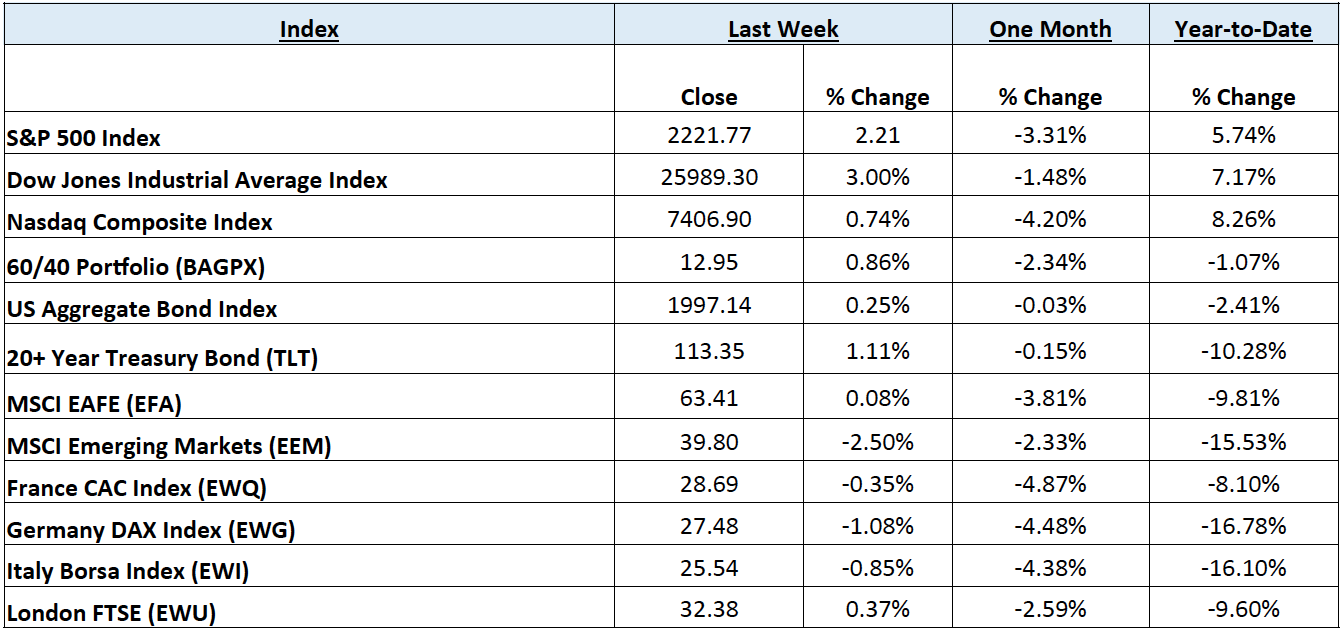
Taking a comprehensive look at the overall current stock market
Taking a comprehensive look at the overall current stock market, you can see the chart below representing eight major indices and their returns through the week ending November 9, 2018. In a truly diversified portfolio, the portfolio’s total return is determined by the performance of all of the individual positions in combination – not individually.
So, understanding the combined overall performance of the indices below, simply average the 12 indices to get a better overall picture of the market. The combined average of all 12 indices is -5.71% year to date.
Data Source: Investors FastTrack, Yahoo Finance, Investopedia
Past performance is not a guarantee of future results. This Update is limited to the dissemination of general information pertaining to its investment advisory services and is not suitable for everyone. The information contained herein should not be construed as personalized investment advice. There is no guarantee that the views and opinions expressed in this newsletter will come to pass. Investing in the stock and bond markets involves gains and losses and may not be suitable for all investors. Information presented herein is subject to change without notice. Horter has experienced periods of underperformance in the past and may also in the future. The returns represented herein are total return inclusive of reinvesting all interest and dividends.
The above equity, bond and cash weightings are targets and may not be the exact current weightings in any particular client account. Specifically, there may be cases where accounts hold higher cash levels than stated in these target weightings. This is usually to accommodate account level activity. Furthermore, some variable annuity and variable universal life accounts may not be able to purchase the exact weightings that we are indicating above due to specific product restrictions, limitations, riders, etc. Please refer to your client accounts for more specifics or call your Horter Investment Management, LLC at (513) 984-9933.
Investment advisory services offered through Horter Investment Management, LLC, a SEC-Registered Investment Advisor. Horter Investment Management does not provide legal or tax advice. Investment Advisor Representatives of Horter Investment Management may only conduct business with residents of the states and jurisdictions in which they are properly registered or exempt from registration requirements. Insurance and annuity products are sold separately through Horter Financial Strategies, LLC. Securities transactions for Horter Investment Management clients are placed through TCA by E*TRADE, TD Ameritrade and Nationwide Advisory Solutions.
For additional information about Horter Investment Management, LLC, including fees and services, send for our disclosure statement as set forth on Form ADV from Horter Investment Management, LLC using the contact information herein. Please read the disclosure statement carefully before you invest or send money.
Dow Jones – Week Ending
WEEKLY MARKET SUMMARY
Global Equities: US equity markets continued with the relief rally since the end of October after closing the chapter on Tuesday’s contentious mid-term elections. The clarity that came from the widely anticipated result was partially clouded on Friday, as fears surrounding an economic slowdown in China and its implications on global growth led to selling pressure, dampening an otherwise stellar week for US equities. The Dow Jones Industrial Average led the major US equity indices, gaining 3.0%, while the so-called “FAANG” stocks weighed on the Nasdaq Composite, which gained only .68%. The Healthcare sector and its Select Sector Healthcare SPDR ETF (XLV) led all major sectors for the week, with a 4% gain. International equities were mixed, as International Developed equities were flat to slightly up, while Emerging Market (EM) equities were pulled down by weakness in Chinese markets, finishing down -2.5%.
Fixed Income: US interest rates were quite volatile during the week, briefly touching 3.25% for the 10-Year US Treasury Bond on election night, before closing lower on the week, near 3.19%. Rising yields on shorter maturity Treasuries, however, forced a tightening in the term premium (10-Year vs. 2-Year) spread from .31% late last week, to .26%. High yield bond spreads over equivalent Treasury securities were also choppy, while high yield bond prices gave up most of their weekly gains on Friday, as the iShares IBoxx High Yield Corporate Bond ETF (HYG) was up only .1%. Lipper reported outflows of $1.04B from high yield bond funds and inflows of $1.849B into investment grade corporate bond funds for the week ending November 7th.
Commodities: Oil prices fell for a fifth consecutive week, plunging technically into a bear market while the US set another record for production of 11.6 million barrels per day as stockpiles continue to rise. Crude prices fell steadily each day, leading to the American West Texas Intermediate (WTI) benchmark losing -4.8% for the week, and the International Brent crude benchmark falling below $70 per barrel. The bid was in for natural gas, however, as prospects for a colder winter pushed prices up over 13% for the week, to $3.73/MMBtu.
WEEKLY ECONOMIC SUMMARY
Producer Price Index (PPI): The Bureau of Labor Statistics PPI for Final Demand reported a “hotter” than expected .6% month-on-month increase for the input price of goods and services in October. The consensus estimate for the period was only .2%, with the high end of the range at .4%. Much of the increase was reportedly from trade services, which includes costs from wholesalers and retailers, and will eventually be passed on to consumers or affect corporate profit margins. The “Core” measure, which excludes the effect of rising food and energy prices, increased .5%, more quickly than expectations of .2%.
Consumer Credit: The Federal Reserve released report for the month of September showed that growth of the total amount of consumer credit outstanding slowed dramatically during the month, only increasing by $10.9B versus an expected $16.5B. The total for revolving credit, which accounts for credit card debt, actually fell $.3B for the period while the figure for non-revolving credit, which includes auto and student loans, accounted for the increase. Consumers’ increased caution during the month despite strong employment may be positive for the long-term health of household finances but detracts from the important consumer spending portion of economic growth.
3rd Quarter Earnings: Cardinal Health, Inc. (CAH), a $16.5B market-cap healthcare services company based in Dublin, Ohio, posted non-GAAP earnings of $1.29 per share on $35.21B in sales for the quarter ended September 30th. Through providing medical products, pharmaceuticals, and solutions to enhance supply chain efficiency for hospitals, CAH was able to earn GAAP earnings per share of $1.94; beating analyst estimates of $.698, and crushing the $.36 per share earned during the same quarter last year. This has allowed management to authorize an upcoming $1B per share buyback that will accompany an expected forward annual dividend of 3.45%. Share buybacks have been a common theme this earnings season and are projected to hit a monthly record in November.
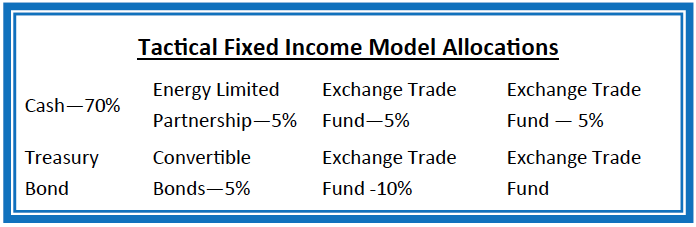
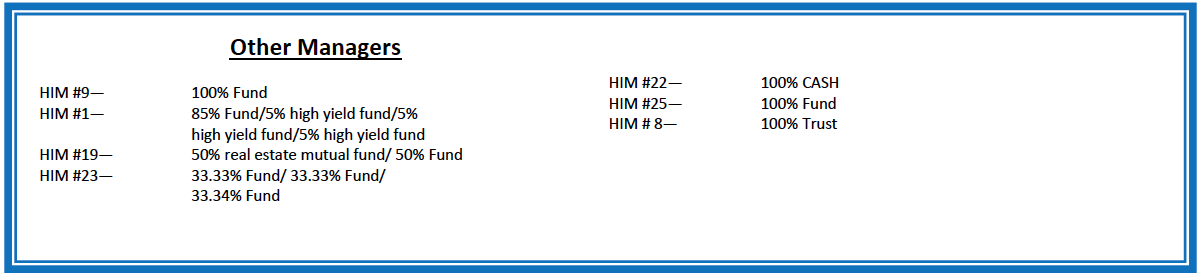
Current Model Allocations
Summary
In utilizing an approach that seeks to limit volatility, it is important to keep perspective of the activity in multiple asset classes. We seek to achieve superior risk-adjusted returns over a full market cycle to a traditional 60% equities / 40% bonds asset allocation. We do this by implementing global mandates of several tactical managers within different risk buckets. For those investors who are unwilling to stomach anything more than minimal downside risk, our goal is to provide a satisfying return over a full market cycle compared to the Barclays Aggregate Bond Index. At Horter Investment Management we realize how confusing the financial markets can be. It is important to keep our clients up to date on what it all means, especially with how it relates to our private wealth managers and their models. We are now in year nine of the most recent bull market, one of
the longest bull markets in U.S. history. At this late stage of the market cycle, it is extremely common for hedged managers to underperform, as they are seeking to limit risk. While none of us know when a market correction will come, even though the movement and volatility sure are starting to act like a correction, our managers have been hired based on our belief that they can accomplish a satisfying return over a full market cycle, — while limiting risk in comparison to a traditional asset allocation approach. At Horter we continue to monitor all of the markets and how our managers are actively managing their portfolios. We remind you there are opportunities to consider with all of our managers. Hopefully this recent market commentary is helpful and thanks for your continued trust and loyalty.