HORTER INVESTMENT MANAGEMENT, LLC
Weekly Commentary horterinvestment.com May 21, 2018
All Signs Point to Recession
We might have just reached an inflection point in the market- economy mechanism. For the first time since 2008, short-term Treasury yields have just reached the same level as equity dividend yields. It is not even the two-year Treasury we are talking about, but rather the three-month, whose yield is now about 1.9%, the same as equities’. The convergence of a number of different yield rates is a strong warning sign of a pending recession. JP Morgan comments that “What has been surprising this year has been the degree to which cross-asset performance has behaved as if the late cycle had already arrived, despite little material change in the growth out-look”

Why 3% Yields Change Everything
Yields on the ten-year Treasury note crossed the 3% threshold this week and seem set to stay there for some time, sparking a big change in bond markets. Bloomberg argues that yields at this level change everything for all asset classes. The reason why is that a jump in yields to above 3% starts to cause a shake out amongst highly indebted companies, boosts the Dollar, and in turn, makes emerging markets less attractive.

FINSUM : To be honest, our biggest concern was not even discussed by Bloomberg, which is how higher yields affect the arithmetic for whether to put money in richly valued stocks, or into bonds that are starting to offer acceptable returns. 3%+ yields really could put an end to this bull market.

Taking a comprehensive look at the overall current stock market
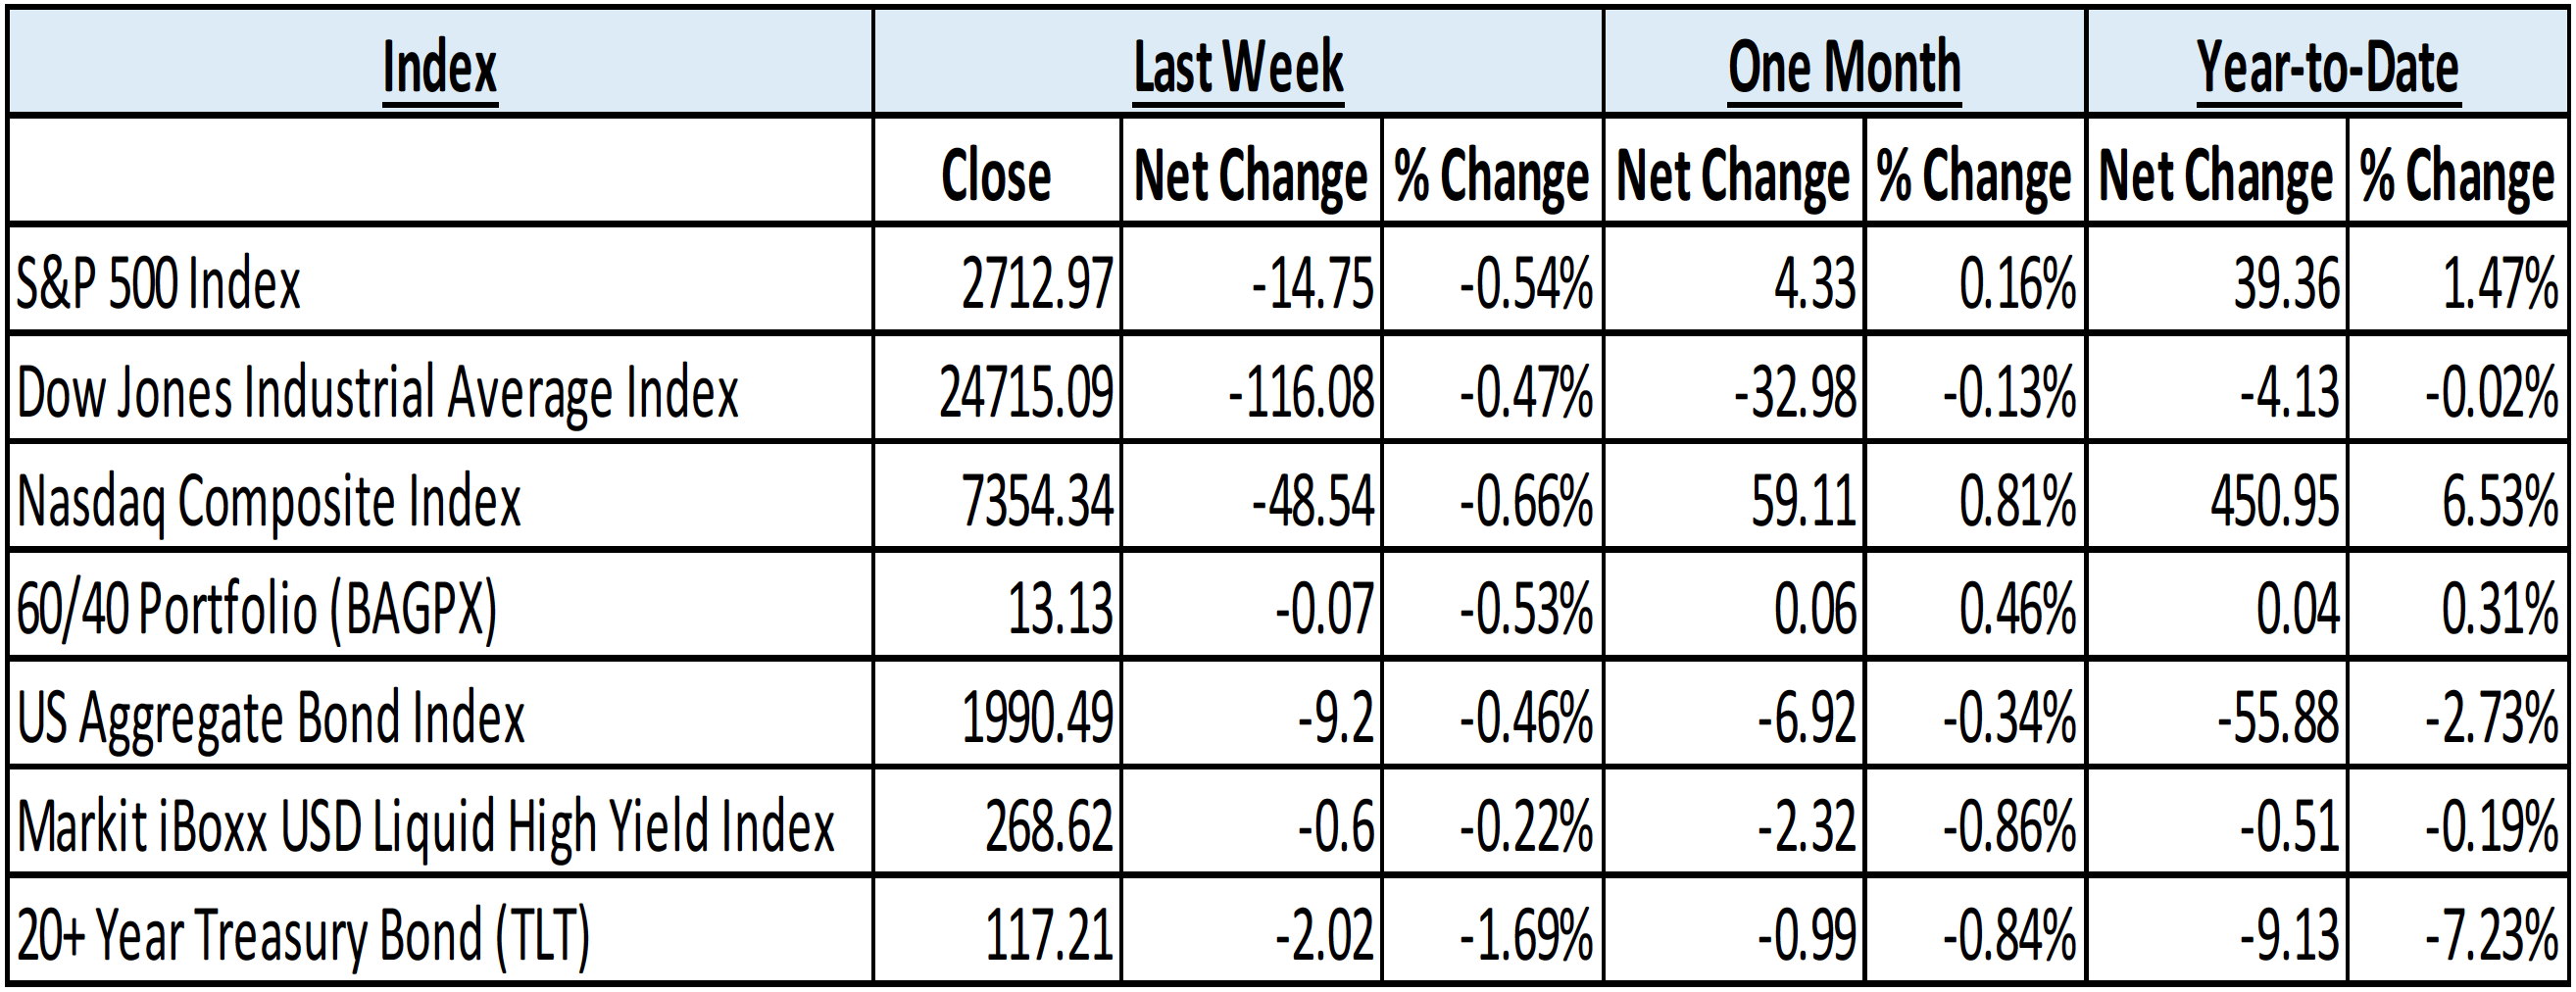
Taking a comprehensive look at the overall current stock market, you can see the chart below representing eight major indices and their returns through the week ending May 18, 2018. In a truly diversified portfolio, the portfolio’s total return is determined by the performance of all of the individual positions in combination – not individually.
So, understanding the combined overall performance of the indices below, simply average the 7 indices to get a better overall picture of the market. The combined average of all 7 indices is –0.27% year to date.
Data Source: Investors FastTrack, Yahoo Finance
Past performance is not a guarantee of future results. This Update is limited to the dissemination of general information pertaining to its investment advisory services and is not suitable for everyone. The information contained herein should not be construed as personalized investment advice. There is no guarantee that the views and opinions expressed in this newsletter will come to pass. Investing in the stock and bond markets involves gains and losses and may not be suitable for all investors. Information presented herein is subject to change without notice. Horter has experienced periods of underperformance in the past and may also in the future. The returns represented herein are total return inclusive of reinvesting all interest and dividends.
The above equity, bond and cash weightings are targets and may not be the exact current weightings in any particular client account. Specifically, there may be cases where accounts hold higher cash levels than stated in these target weightings. This is usually to accommodate account level activity. Furthermore, some variable annuity and variable universal life accounts may not be able to purchase the exact weightings that we are indicating above due to specific product restrictions, limitations, riders, etc. Please refer to your client accounts for more specifics or call your Horter Investment Management, LLC at (513) 984-9933.
Investment advisory services offered through Horter Investment Management, LLC, a SEC-Registered Investment Advisor. Horter Investment Management does not provide legal or tax advice. Investment Advisor Representatives of Horter Investment Management may only conduct business with residents of the states and jurisdictions in which they are properly registered or exempt from registration requirements. Insurance and annuity products are sold separately through Horter Financial Strategies, LLC. Securities transactions for Horter Investment Management clients are placed through TCA by E*TRADE, TD Ameritrade and Nationwide Advisory Solutions.
For additional information about Horter Investment Management, LLC, including fees and services, send for our disclosure statement as set forth on Form ADV from Horter Investment Management, LLC using the contact information herein. Please read the disclosure statement carefully before you invest or send money.
Dow Jones – Week Ending
WEEKLY MARKET SUMMARY
Global Equities: Spiking interest rates put a damper on equity prices during weekly trading despite the stellar corporate earnings results, thus far. All three major US indices were slightly in the red for the week, with the Nasdaq Composite down the most, losing around .6%. The interest rate sensitive Real-Estate and Utilities sectors lagged during the week, as their corresponding SPDR ETF’s XLRE and XLU were down around 3%. The Energy sector continued its outperformance despite a Friday slump, with its Select Sector SPDR Fund (ticker XLE) leading all other S&P sectors up nearly 1.75%. Small-cap equities displayed excellent relative outperformance with the iShares Russell 2000 Index Fund ETF (IWM) up around 1.4%, while higher rates and US dollar hit Emerging Market equities relatively hard as the iShares MSCI Emerging Markets Index ETF (EEM) lost around 2.75%.
Fixed Income: The yield on the US 10-Year Treasury Note was finally able to break solidly above the psychological 3% barrier and major technical resistance of 3.05% to a 7-year high during the week. While the rapid pace of the increase hit emerging markets especially hard, it was surprisingly not as detrimental to US equity prices. Treasury term-premium yield spreads, the extra yield paid for longer dated bonds, widened during the week, with the spread between the 10-year and the 2-year widening back to .33%. High-yield debt funds recorded outflows as their corresponding spreads over risk-free securities were relatively unchanged for the week.
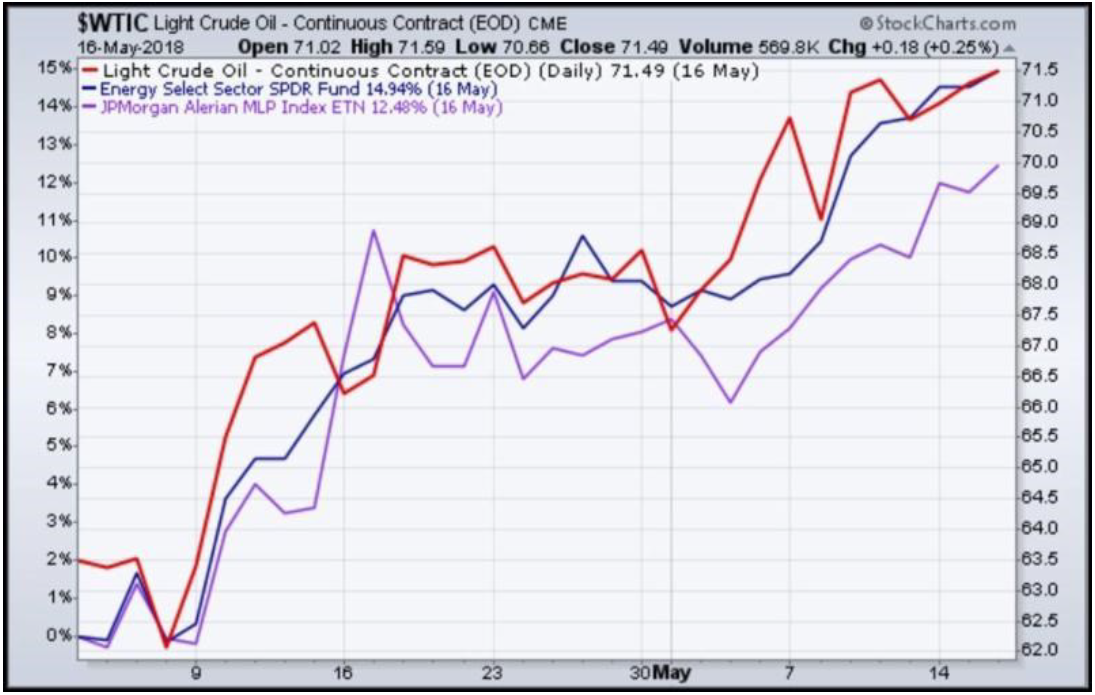
Commodities: With geo-political tensions not assuaged and problems mounting in Venezuela, supply concerns are contributing to continued rising world oil prices. Meanwhile, US corporations have steadily increased their production and are exporting what would have been, in the past, increasing inventory. Brent Crude ended the week near $78.60 per barrel, after rising above $80 mid-week; while the American West Texas Intermediate price increased to around $71.30 per barrel. Natural Gas prices ended the week higher, at $2.84/MMBtu.
WEEKLY ECONOMIC SUMMARY
Leading Economic Indicators (LEI): The Conference Board Leading Economic Index (LEI) has continued its rise, up .4% for the month of April. The LEI, which uses weighted data inputs generally thought of as “leading” to try to signal peaks and troughs in the business cycle, is indicating continued strength. Labor market components that hurt the index in March showed improvement, while stock prices and building permits were the only negatives out of the ten total contributors for April. The LEI grew 3.3% for the 6-month period ended in April, faster than the prior 6 months’ gain of 3%.
Jobless Claims: Initial jobless claims of 222,000 for the week ended May 12th exceeded the consensus estimate of 215,000. This report decreased the 4-week average, however, which is at its lowest level since 1969. Continuing claims from people already collecting unemployment fell to 1.71 million. High numbers of job openings and unemployment under 4% looks to continue this tight labor market at least into the second half of 2018.
Housing Market Index: Home builder confidence increased in May according to the National Association of Home Builders/Wells Fargo housing market index. The level came in at 70, higher than consensus estimates and significant when any reading above 50 means that more builders view conditions as favorable. Low unemployment, low inventory, and low but rising mortgage rates are contributing positively to consumer demand for single-family homes. There are concerns, however, of rising input costs squeezing margins and pricing would-be first-time home buyers out of the market.
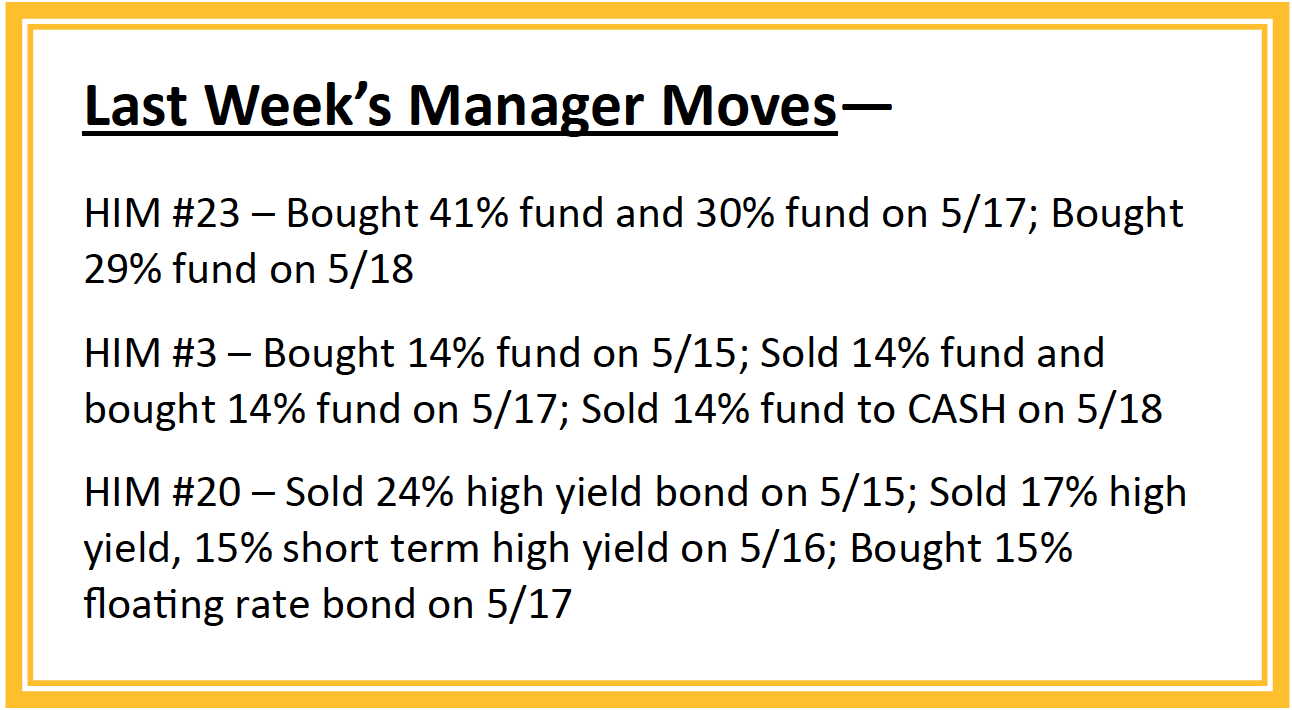
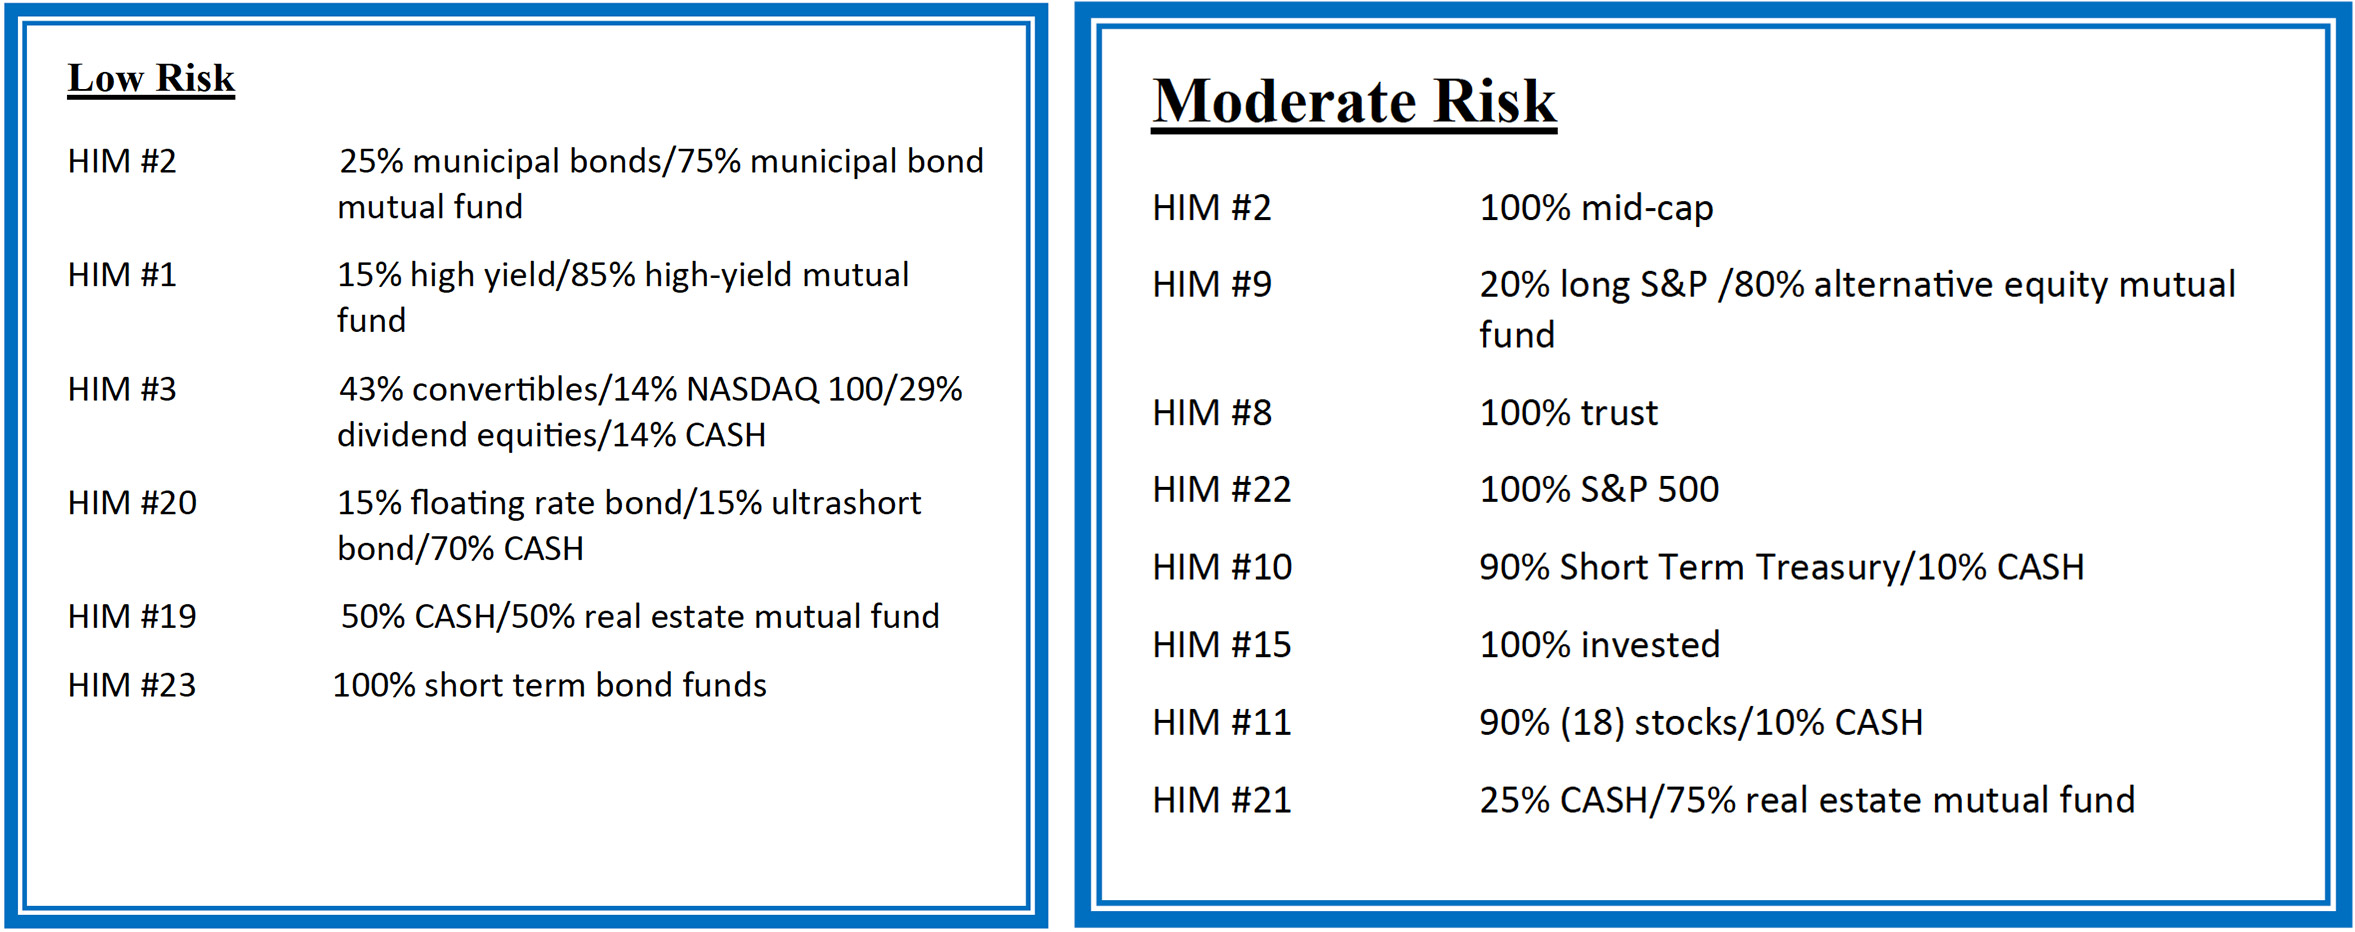
Current Model Allocations
Summary
In utilizing an approach that seeks to limit volatility, it is important to keep perspective of the activity in multiple asset classes. We seek to achieve superior risk-adjusted returns over a full market cycle to a traditional 60% equities / 40% bonds asset allocation. We do this by implementing global mandates of several tactical managers within different risk buckets. For those investors who are unwilling to stomach anything more than minimal downside risk, our goal is to provide a satisfying return over a full market cycle compared to the Barclays Aggregate Bond Index. At Horter Investment Management we realize how confusing the financial markets can be. It is important to keep our clients up to date on what it all means, especially with how it relates to our private wealth managers and their models. We are now in year nine of the most recent bull market, one of
the longest bull markets in U.S. history. At this late stage of the market cycle, it is extremely common for hedged managers to underperform, as they are seeking to limit risk. While none of us know when a market correction will come, even though the movement and volatility sure are starting to act like a correction, our managers have been hired based on our belief that they can accomplish a satisfying return over a full market cycle, —while limiting risk in comparison to a traditional asset allocation approach. At Horter we continue to monitor all of the markets and how our managers are actively managing their portfolios. We remind you there are opportunities to consider with all of our managers. Hopefully this recent market commentary is helpful and thanks for your continued trust and loyalty.