HORTER INVESTMENT MANAGEMENT, LLC
Weekly Commentary horterinvestment.com March 4, 2019
The Yield Curve is Shouting “Recession”
Stock investors may have largely moved on from day to day concerns about a pending recession, but important parts of the bond market are still signaling a downturn is coming. For instance, the 1 to 5-year spread in Treasuries inverted at then end of December, and despite the Fed making a big policy u-turn, has remained inverted ever since. The spread is currently minus 7 basis points. It is important to remember that the entire yield curve does not invert at once, it happens in stages, and this particular measure has proven to be a good recession indicator in the past.

Treasury yields slightly lower amid reports of US-China trade progress
U.S. government debt prices were marginally higher Monday amid reports of improving progress in trade negotiations with China.

The yield on the benchmark 10-year Treasury note sank slightly to around 2.748 percent, while the yield on the 30-year Treasury bond slipped to 3.114 percent. Bond yields move inversely to prices.
Investor focus was mostly attuned to global trade developments Monday, after a Wall Street Journal report overnight said that the U.S. and China were closing in on a deal.
The paper reported Sunday that China had offered to lower tariffs on U.S. farm, chemical and auto products as part of a trade agreement, while the U.S. was considering removing most, if not all, duties imposed on Chinese products last year.

Taking a comprehensive look at the overall current stock market
Taking a comprehensive look at the overall current stock market, you can see the chart below r epresenting eight major indices and their returns through the week ending March 1, 2019. In a truly diversified portfolio, the portfolio’s total return is determined by the performance of all of the individual positions in combination – not individually.
So, understanding the combined overall performance of the indices below, simply average the 12 indices to get a better overall picture of the market. The combined average of all 12 indices is 9.25% year to date.
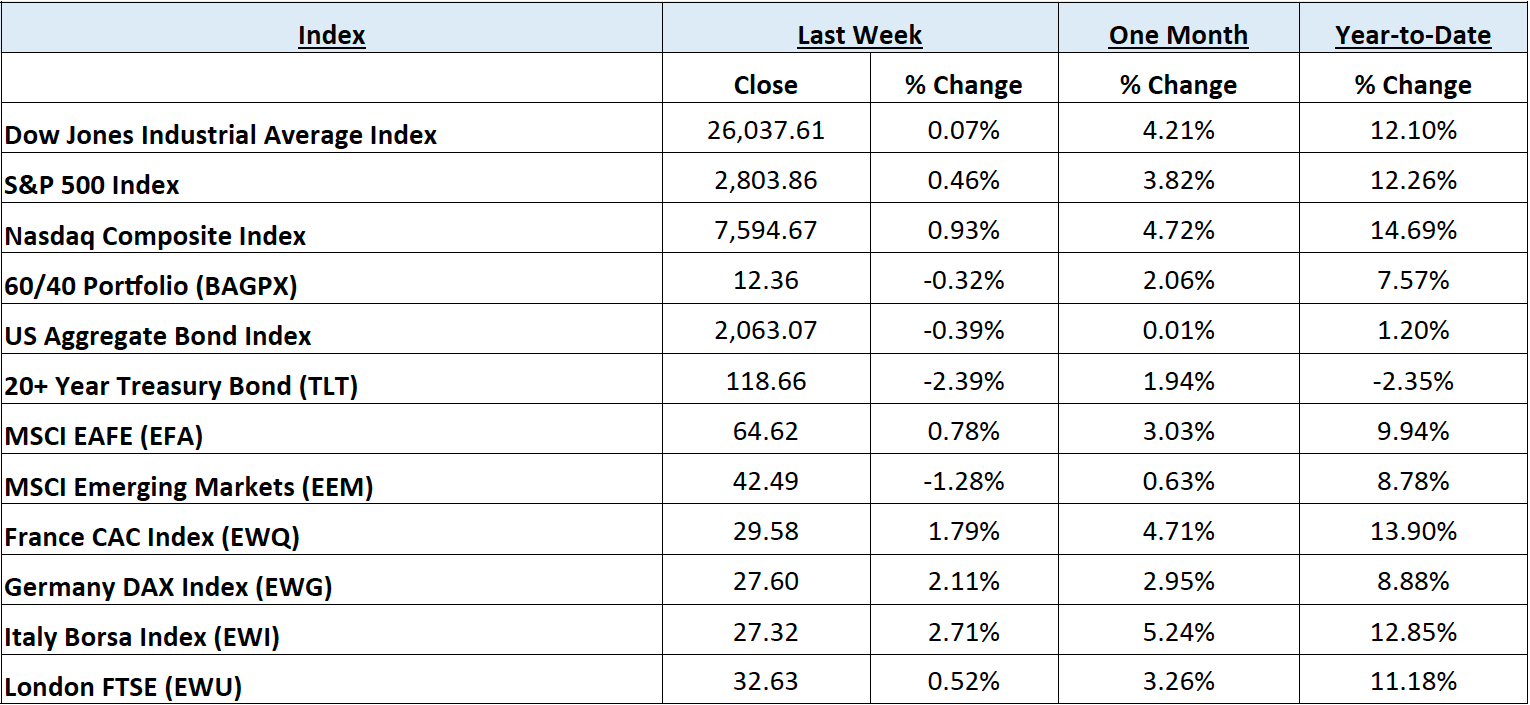
Data Source: Investors FastTrack, Yahoo Finance, Investopedia

Past performance is not a guarantee of future results. This Update is limited to the dissemination of general information pertaining to its investment advisory services and is not suitable for everyone. The information contained herein should not be construed as personalized investment advice. There is no guarantee that the views and opinions expressed in this newsletter will come to pass. Investing in the stock and bond markets involves gains and losses and may not be suitable for all investors. Information presented herein is subject to change without notice. Horter has experienced periods of underperformance in the past and may also in the future. The returns represented herein are total return inclusive of reinvesting all interest and dividends.
The above equity, bond and cash weightings are targets and may not be the exact current weightings in any particular client account. Specifically, there may be cases where accounts hold higher cash levels than stated in these target weightings. This is usually to accommodate account level activity. Furthermore, some variable annuity and variable universal life accounts may not be able to purchase the exact weightings that we are indicating above due to specific product restrictions, limitations, riders, etc. Please refer to your client accounts for more specifics or call your Horter Investment Management, LLC at (513) 984-9933.
Investment advisory services offered through Horter Investment Management, LLC, a SEC-Registered Investment Advisor. Horter Investment Management does not provide legal or tax advice. Investment Advisor Representatives of Horter Investment Management may only conduct business with residents of the states and jurisdictions in which they are properly registered or exempt from registration requirements. Insurance and annuity products are sold separately through Horter Financial Strategies, LLC. Securities transactions for Horter Investment Management clients are placed through E*TRADE Advisor Services, TD Ameritrade and Nationwide Advisory Solutions.
For additional information about Horter Investment Management, LLC, including fees and services, send for our disclosure statement as set forth on Form ADV from Horter Investment Management, LLC using the contact information herein. Please read the disclosure statement carefully before you invest or send money.
Dow Jones – Week Ending
WEEKLY MARKET SUMMARY
Global Equities: Equities ended the week mixed, with the S&P 500 Index and the Nasdaq Composite Index slightly higher and the Dow Jones Industrial Average slightly negative, as bears attempted and failed mid-week to breach support of a rising trend. US Federal Reserve (Fed) Board Chairman Jerome Powell testified before congress, reiterating the ability and willing-ness to be patient in raising rates while monitoring the global economy which appears to be diverging with US GDP beating expectations and continued dismal data abroad. Developed International stocks had performance commensurate with US equities, with the iShares MSCI EAFE Index Fund ETF (EFA) gaining .78%. Emerging Markets slumped, as the iShares MSCI Emerging Market Index ETF (EEM) dipped -1.3% for the week.
Fixed Income: The yield on the 10-year US Treasury Note rose sharply to nearly 2.76% after a release of better-than-expected 4th quarter (Q4) GDP and a pop in high grade corporate debt issuance. Bloomberg reported that February issuance of high grade corporate bonds was nearly 30% higher than in the same month of 2018. This move had a steepening effect on the yield curve, with the 10-year over the 2-year Treasury (10-2 spread) yield spread moving from .15% to .21% by the end of the week. High yield bond spreads narrowed again, as the iShares IBoxx High Yield Corporate Bond ETF (HYG) had another positive week despite Moody’s year-to-date credit downgrades to upgrades being nearly 2-1. Lipper reported another week of net inflows into high yield funds of $698 million for the week ended 2/27.
Commodities: For the second week in a row, the Energy Information Administration (EIA) reported record-breaking production by the US for the week ended February 22nd despite a falling rig count by Baker Hughes. This time, however, oil prices slipped after a volatile week fed by trade deal optimism and weakness in US manufacturing demand. The West Texas Intermediate (WTI) benchmark dropped -2.5% to $55.75 per barrel, while the International Brent crude benchmark dropped -3% to close near $64.93 per barrel. Natural gas prices rose over 5% despite nearing the end of the heating season to $2.85/ MMBtu.
WEEKLY ECONOMIC SUMMARY
Gross Domestic Product (GDP): The preliminary estimate for Q4 US Real GDP was released on Thursday with an upside surprise annualized quarter-on-quarter (QoQ) growth rate of 2.6%, closing out a positive year for economic growth of 2.9% for 2018. The quarter was highlighted by growth in consumer spending, particularly on services, and business investment. The momentum is not expected to continue into 2019 thanks to base effects, the government shutdown, and a wear-ing-off of the tax cut boost, with falling GDP growth expectaions including the Atlanta Fed’s GDPNow to just 0.3% for Q1 2019.
Personal Income & Outlays: Personal income increased by 1% for December, outside the high end of the consensus range of .2%-.5%, according to the Bureau of Economic Analysis (BEA). Consumer spending slipped lower than expected, falling -.5% month-on-month (MoM). Personal Consumption Expenditures (PCE), a measure of inflation, was in line with consensus on both the MoM and year-on-year (YoY) measures of .1% and 1.7%, respectively. Core PCE, the favorite measure of inflation for the Federal Reserve (Fed), which excludes food & energy, was also in line with the consensus estimate and near the Fed’s target of 2%, at 1.9% YoY.
Q4 Earnings Season: There were a flurry of retail earnings announcements during the week that were positively perceived by markets, but for wildly different reasons. T.J. Maxx (TJX), the off-price apparel retailer surprised with better-than-expected fiscal 4th quarter same store sales, while boosting its dividend and plans to repurchase its own shares. Conversely, after reporting plummeting same store sales, shares of struggling rreetailer J.C. Penney (JCP) rose over 20% after announcing plans to shutter 18 additional department stores and 9 of its home & furniture locations in 2019. Gap Inc. (GPS) also impressed with its plans to reorganize its operations and split into two different companies, with its growing Old Navy brand splitting out from a yet-to-be-named company that will include, among others, the Gap and Banana Republic brands.
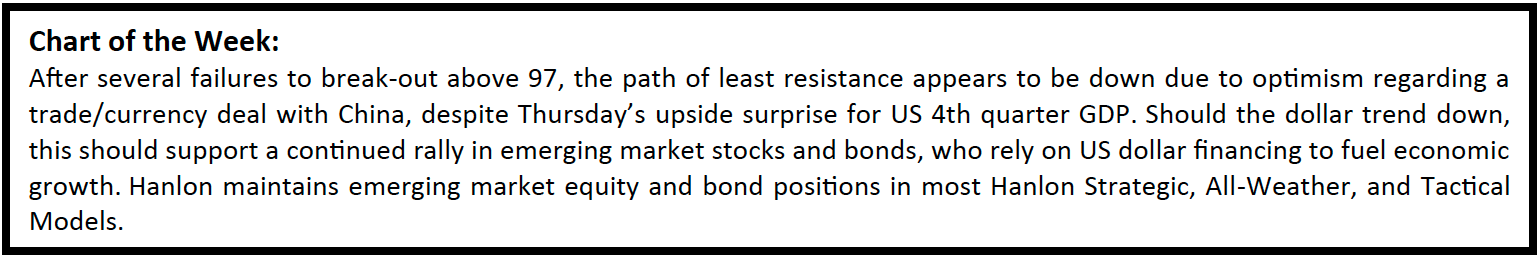
Current Model Allocations
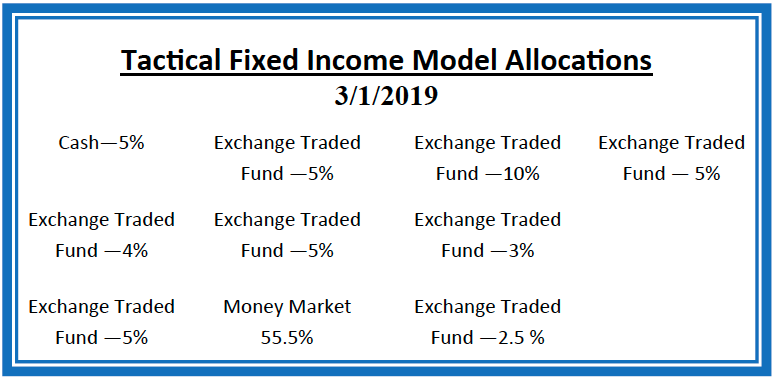
Data Source: Hanlon Investment Management 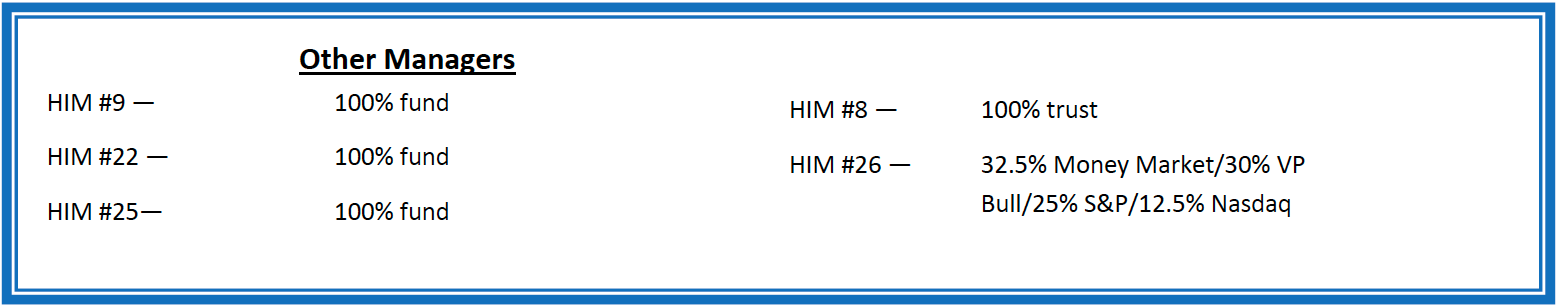
Summary
In utilizing an approach that seeks to limit volatility, it is important to keep perspective of the activity in multiple asset classes. We seek to achieve superior risk-adjusted returns over a full market cycle to a traditional 60% equities / 40% bonds asset allocation. We do this by implementing global mandates of several tactical managers within different risk buckets. For those investors who are unwilling to stomach anything more than minimal downside risk, our goal is to provide a satisfying return over a full market cycle compared to the Barclays Aggregate Bond Index. At Horter Investment Management we realize how confusing the financial markets can be. It is important to keep our clients up to date on what it all means, especially with how it relates to our private wealth managers and their models. We are now in year nine of the most recent bull market, one of
the longest bull markets in U.S. history. At this late stage of the market cycle, it is extremely common for hedged managers to underperform, as they are seeking to limit risk. While none of us know when a market correction will come, even though the movement and volatility sure are starting to act like a correction, our managers have been hired based on our belief that they can accomplish a satisfying return over a full market cycle, – while limiting risk in comparison to a traditional asset allocation approach. At Horter we continue to monitor all of the markets and how our managers are actively managing their portfolios. We remind you there are opportunities to consider with all of our managers. Hopefully this recent market commentary is helpful and thanks for your continued trust and loyalty.
Data Source: Hanlon Investment Management