HORTER INVESTMENT MANAGEMENT, LLC
Weekly Commentary horterinvestment.com March 11, 2019
The stock market and the economy are telling two different stories
The S&P 500’s monster rally has notched the best two-month start to a year since 1991, but by one simple measure, the market pricing seems to be ignoring the economic reality.
Starting at a few points below 2,800 on Tuesday, the S&P 500 is currently trading at more than 16 times the 2019 earnings estimate for the S&P 500 firms of $172.50. But with all the bearish signs in the market — from slowing global growth to downward earnings revisions to recession fears and the Federal Reserve’s tightening possibilities — the stock valuation is looking too high and is assuming the risks would be resolved in a positive way, according to Tom Essaye, founder of Sevens Report Research.
“On a valuation basis this market has risen to reflect a macro environment that is materially more positive than the one we currently have, and as a fundamentals-driven analyst, that makes me nervous over the medium term,” Essaye said in a note Tuesday.
“The current macro setup much more matches the ‘Scattered Storms’ scenario, but the market valuation is reflective of a ‘Partly Sunny’ environment. That’s a discrepancy that will have to close,” Essaye pointed out, comparing market multiples to a weather forecast.

The Fed doesn’t have to worry about high inflation anymore, and that’s a problem

There was a time not so long ago that defeating inflation would have been considered a huge victory for the Federal Reserve. No more: The lack of price and wage pressures in the economy these days is perhaps the central bank’s biggest failing.
For those around in the 1970s and early ’80s, runaway inflation was the single biggest threat to American prosperity. It was so bad that then-Fed Chairman Paul Volcker deliberately pulled the country into recession in order to defeat runaway prices.
Nowadays, the exact opposite is true. While Americans will still complain about the prices they pay at the grocery store and gas pump, real inflation as economists define it hasn’t been around for pretty much all of the 21st century.
In fact, Fed officials are concerned enough about the lack of inflation that they will be examining it closely this year as part of a broader look at how they execute policy and convey their actions to the public.

Taking a comprehensive look at the overall current stock market
Taking a comprehensive look at the overall current stock market, you can see the chart below representing eight major indices and their returns through the week ending March 8, 2019. In a truly diversified portfolio, the portfolio’s total return is determined by the performance of all of the individual positions in combination – not individually.
So, understanding the combined overall performance of the indices below, simply average the 12 indices to get a better overall picture of the market. The combined average of all 12 indices is 7.65% year to date.
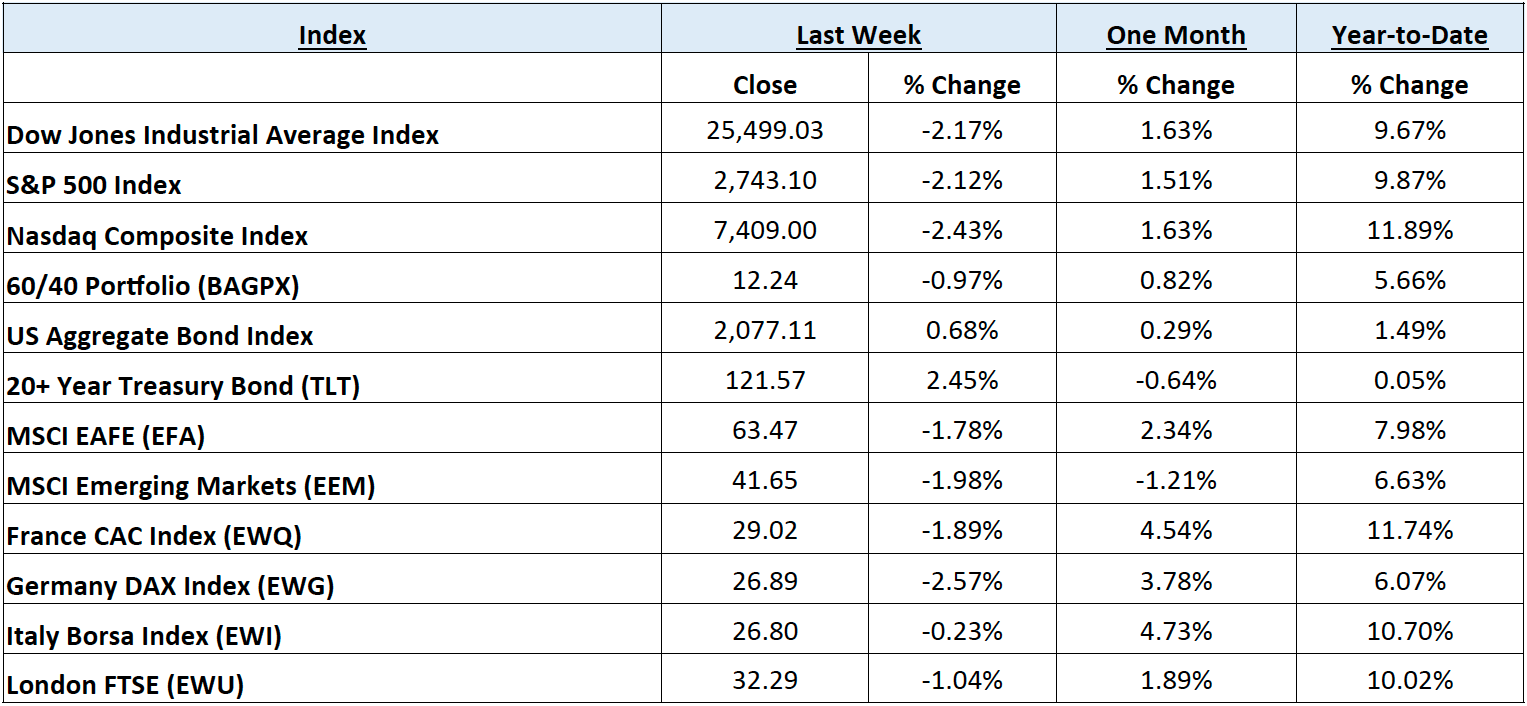
Data Source: Investors FastTrack, Yahoo Finance, Investopedia

Past performance is not a guarantee of future results. This Update is limited to the dissemination of general information pertaining to its investment advisory services and is not suitable for everyone. The information contained herein should not be construed as personalized investment advice. There is no guarantee that the views and opinions expressed in this newsletter will come to pass. Investing in the stock and bond markets involves gains and losses and may not be suitable for all investors. Information presented herein is subject to change without notice. Horter has experienced periods of underperformance in the past and may also in the future. The returns represented herein are total return inclusive of reinvesting all interest and dividends.
The above equity, bond and cash weightings are targets and may not be the exact current weightings in any particular client account. Specifically, there may be cases where accounts hold higher cash levels than stated in these target weightings. This is usually to accommodate account level activity. Furthermore, some variable annuity and variable universal life accounts may not be able to purchase the exact weightings that we are indicating above due to specific product restrictions, limitations, riders, etc. Please refer to your client accounts for more specifics or call your Horter Investment Management, LLC at (513) 984-9933.
Investment advisory services offered through Horter Investment Management, LLC, a SEC-Registered Investment Advisor. Horter Investment Management does not provide legal or tax advice. Investment Advisor Representatives of Horter Investment Management may only conduct business with residents of the states and jurisdictions in which they are properly registered or exempt from registration requirements. Insurance and annuity products are sold separately through Horter Financial Strategies, LLC. Securities transactions for Horter Investment Management clients are placed through E*TRADE Advisor Services, TD Ameritrade and Nationwide Advisory Solutions.
For additional information about Horter Investment Management, LLC, including fees and services, send for our disclosure statement as set forth on Form ADV from Horter Investment Management, LLC using the contact information herein. Please read the disclosure statement carefully before you invest or send money.
Dow Jones – Week Ending
WEEKLY MARKET SUMMARY
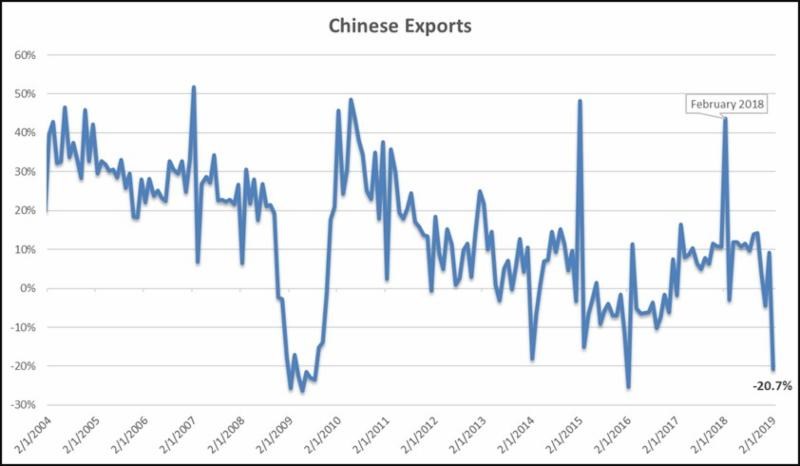
Global Equities: An early week failure to break-out above technical resistance at prior highs induced selling of cyclical equity sectors and, combined with disappointing trade data out of China and a somewhat surprising dovish pivot from the European Central Bank (ECB), led to losses for the broad equity indices. The Nasdaq Composite Index led major US indices to the downside, losing -2.63%, while the S&P 500 Index and the Dow Jones Industrial Average lost -2.15% and -2.22%, respectively. The defensive Utilities sector outperformed all other S&P sectors, as the SPDR Select Sector Utilities ETF (XLU) gained .82% on the week. International equities, broadly, held up slightly better than US markets as Developed International stocks represented by the iShares MSCI EAFE Index Fund ETF (EFA) fell -1.78%, and Emerging Markets represented by the iShares MSCI Emerging Market Index ETF (EEM) dropped -1.98% during the week.
Fixed Income: After rising quickly above 2.75% during the previous week, the yield on the 10-year US Treasury Note dropped as sharply back below 2.64% as investors piled back into safe haven assets. The German 10-year Bund yield dropped in tandem, from nearly .20% a week ago, to a mere .07% as the ECB announced a third round of targeted longer-term refinancing operations, which rewards banks who make more loans. This also had the effect of strengthening the US Dollar Index, which is heavily weighted versus the Euro, as yields on US Treasuries continue to remain relatively attractive. High yield bond spreads widened slightly over 4%, as the iShares IBoxx High Yield Corporate Bond ETF (HYG) ended its hot streak with a -.59% drop on the week. Lipper reported net outflows from high yield funds of $1.907 billion for the week ended 3/6.
Commodities: Oil prices held up rather well during the week considering the late-week negative economic news out of China and the US. Prices dropped and recovered on Friday, due likely to another confirmation that Saudi Arabia is holding to their pledged production cuts. Energy sector equities were knocked around, however, as Norway’s sovereign wealth fund, the world’s largest, announced that they would be following through on a government recommendation to exit all investments in oil and gas production, in taking a “more cautious approach” to energy investments. The West Texas Intermediate (WTI) benchmark was relatively firm at $56 per barrel, while the International Brent crude benchmark rose slightly to close near $65.66 per barrel. Natural gas prices were steady, rising a penny to $2.86/MMBtu.
WEEKLY ECONOMIC SUMMARY
Employment Situation: Job growth fell well short of consensus estimates for the month of February as Nonfarm Payrolls increased by 20,000 versus an expectation of 180,000, per the Bureau of Labor Statistics. This, the weakest month for job growth since September of 2017 also saw a decrease in the unemployment rate from 4% to 3.8% due to a large increase in those leaving the labor force. Average hourly earnings have started to reflect the strength in the labor market, accelerating slightly higher than consensus to 3.4% year-on-year. The average work week slipped from 34.5 to 34.4 hours.
ISM Non-Manufacturing Survey: The Institute for Supply Management (ISM) released the results of its monthly survey based on respondents from the non-manufacturing sector for the month of February. The reading of 59.7 was well above the consensus estimate of 57.2, indicating robust growth in new orders, exports, and a corresponding growth in backlogs. The non-manufacturing sector has diverged from manufacturing as growth in service exports continues to be a major strength of the US economy, helping to offset the sector’s slumping effect on US GDP.
Federal Reserve (Fed) Balance Sheet: The Fed balance sheet dropped by $5.5 billion during the week ending March 6th, as Treasury holdings and mortgage-backed securities (MBS) matured. So far, the total amount on the balance sheet is down $491.3 billion to $3.969 trillion since the start of the unwinding in October 2017. The Fed is still scheduled to let $30 billion in Treasuries and $20 billion in MBS roll off per month but have signaled that it may end before 2019 is over, and much earlier than anticipated due to sputtering global growth.
Current Model Allocations
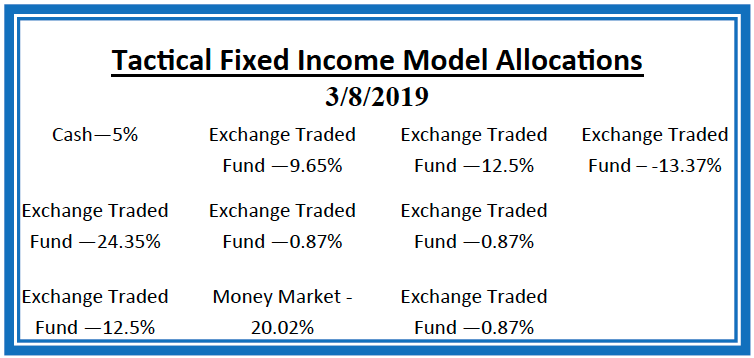
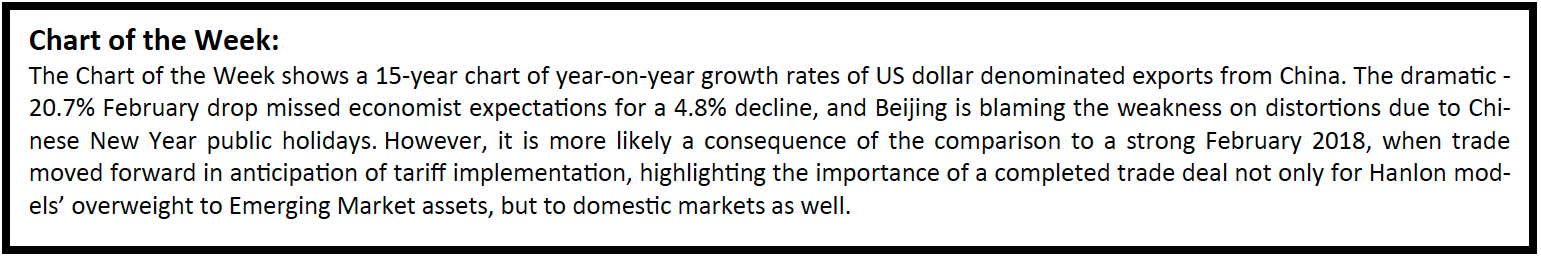
Data Source: Hanlon Investment Management 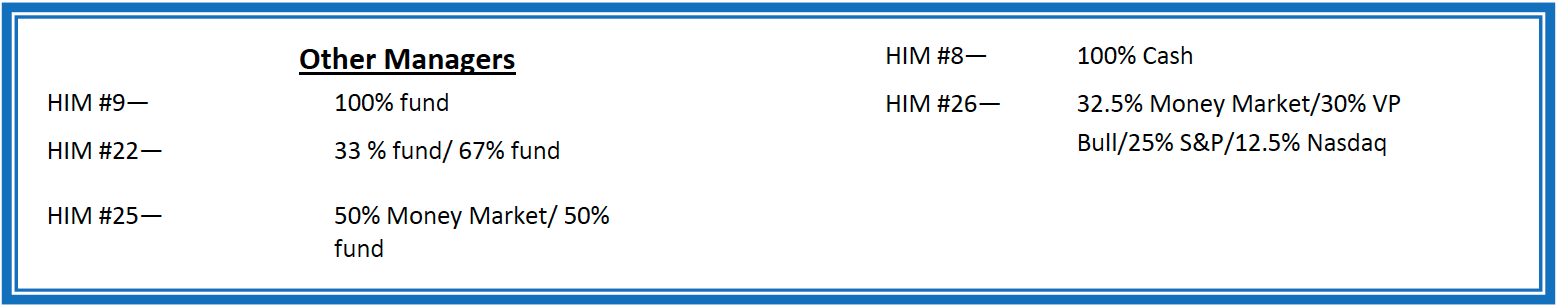
Summary
In utilizing an approach that seeks to limit volatility, it is important to keep perspective of the activity in multiple asset classes. We seek to achieve superior risk-adjusted returns over a full market cycle to a traditional 60% equities / 40% bonds asset allocation. We do this by implementing global mandates of several tactical managers within different risk buckets. For those investors who are unwilling to stomach anything more than minimal downside risk, our goal is to provide a satisfying return over a full market cycle compared to the Barclays Aggregate Bond Index. At Horter Investment Management we realize how confusing the financial markets can be. It is important to keep our clients up to date on what it all means, especially with how it relates to our private wealth managers and their models. We are now in year nine of the most recent bull market, one of
the longest bull markets in U.S. history. At this late stage of the market cycle, it is extremely common for hedged managers to underperform, as they are seeking to limit risk. While none of us know when a market correction will come, even though the movement and volatility sure are starting to act like a correction, our managers have been hired based on our belief that they can accomplish a satisfying return over a full market cycle, – while limiting risk in comparison to a traditional asset allocation approach. At Horter we continue to monitor all of the markets and how our managers are actively managing their portfolios. We remind you there are opportunities to consider with all of our managers. Hopefully this recent market commentary is helpful and thanks for your continued trust and loyalty.
Data Source: Hanlon Investment Management