HORTER INVESTMENT MANAGEMENT, LLC
Weekly Commentary horterinvestment.com June 25, 2018
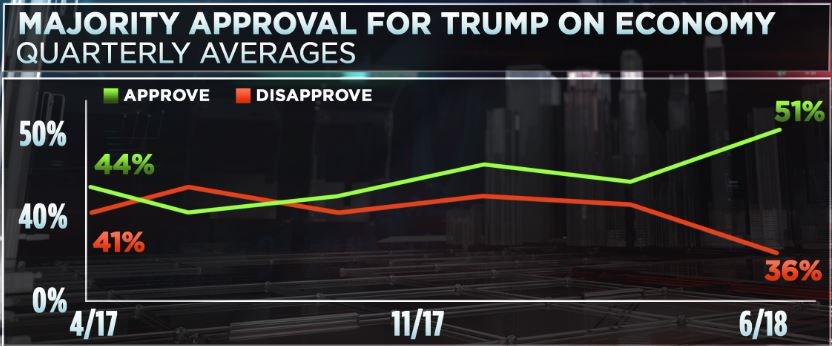
Majority of Americans Approve of Trump’s Handling of the Economy for the First Time
For the first time since President Donald Trump took office, the CNBC All-America Economic Survey shows more than half the public approving his handling of the economy, and it appears to be having some impact on his overall job approval rating.
The president’s economic approval rating surged 6 points to 51 percent with just 36 percent of the public disapproving, a 6 point drop from the March Survey.
His overall approving rating rose 2 points to 41 percent from the first quarter survey, but the percentage of Americans who disapprove dropped 10 points to 47 percent, the lowest recorded by CNBC during his presidency. Trump’s approval rating remains negative, at minus 6, but it’s also the lowest negative rating recorded since he took office.
The survey suggests that the recent controversy over the president’s decision to separate children from their parents at the border has had little effect either way.
The poll of 800 adults nationwide, with a margin of error of plus or minus 3.5 percentage points, was conducted June 16 thru 19 while
the controversy over the separation of children from their parents dominated the news. But any impact on the president’s approval rating is difficult to find in the data. A comparison of the polling conducted Saturday and Sunday with Monday and Tuesday, when the story was more prominent, shows little difference despite considerable public outrage.
Recession Alert—The Yield Curve Just Inverted
Investors beware, the strongest predictor of recession has just rung its bell. An inverted yield curve has predicted all six of the US recessions going back 60 years. And while all of investors’ focus has been on whether the Treasury yield curve will invert, the global yield

curve already has. The yield on the ICE Bank of America index of government bonds due in 7 to 10 years has already inverted, with such yields being lower than for 1 to 3 year bonds. While the US economy is currently looking strong, there is growing weakness in Europe, China, and emerging markets, which seems to have inverted the curve. The IMF says the clouds over the world’s economy are “getting darker by the day”.
FINSUM: It is seeming more and more like we will have a global recession. Though, the US seems like it will be the last to succumb to it. One thing to remember—in the US it takes an average of 18.5 months from when the curve inverts to when we reach the peak of the growth cycle.

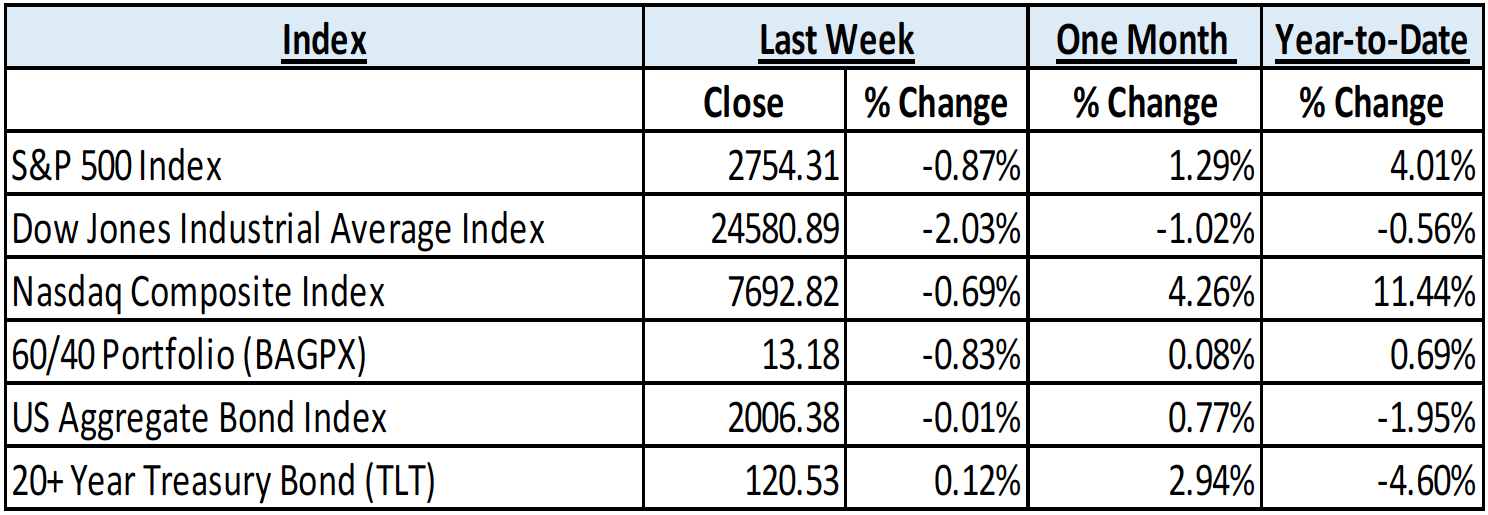
Taking a comprehensive look at the overall current stock market
Taking a comprehensive look at the overall current stock market, you can see the chart below representing eight major indices and their returns through the week ending June 25, 2018. In a truly diversified portfolio, the portfolio’s total return is determined by the performance of all of the individual positions in combination – not individually.
So, understanding the combined overall performance of the indices below, simply average the 6 indices to get a better overall picture of the market. The combined average of all 6 indices is 1.51% year to date.
Data Source: Investors FastTrack, Yahoo Finance

Past performance is not a guarantee of future results. This Update is limited to the dissemination of general information pertaining to its investment advisory services and is not suitable for everyone. The information contained herein should not be construed as personalized investment advice. There is no guarantee that the views and opinions expressed in this newsletter will come to pass. Investing in the stock and bond markets involves gains and losses and may not be suitable for all investors. Information presented herein is subject to change without notice. Horter has experienced periods of underperformance in the past and may also in the future. The returns represented herein are total return inclusive of reinvesting all interest and dividends.
The above equity, bond and cash weightings are targets and may not be the exact current weightings in any particular client account. Specifically, there may be cases where accounts hold higher cash levels than stated in these target weightings. This is usually to accommodate account level activity. Furthermore, some variable annuity and variable universal life accounts may not be able to purchase the exact weightings that we are indicating above due to specific product restrictions, limitations, riders, etc. Please refer to your client accounts for more specifics or call your Horter Investment Management, LLC at (513) 984-9933.
Investment advisory services offered through Horter Investment Management, LLC, a SEC-Registered Investment Advisor. Horter Investment Management does not provide legal or tax advice. Investment Advisor Representatives of Horter Investment Management may only conduct business with residents of the states and jurisdictions in which they are properly registered or exempt from registration requirements. Insurance and annuity products are sold separately through Horter Financial Strategies, LLC. Securities transactions for Horter Investment Management clients are placed through TCA by E*TRADE, TD Ameritrade and Nationwide Advisory Solutions.
For additional information about Horter Investment Management, LLC, including fees and services, send for our disclosure statement as set forth on Form ADV from Horter Investment Management, LLC using the contact information herein. Please read the disclosure statement carefully before you invest or send money.
Dow Jones – Week Ending
WEEKLY MARKET SUMMARY
Global Equities: The Dow Jones Industrial Average led all the major US equity indices lower during the week thanks to an extreme ratcheting up of trade war rhetoric between the Trump administration and China. Despite small rallies for the S&P 500 and the Dow Jones on Friday, the Nasdaq Composite outperformed by only losing around .5% for the week. Generally defensive Utilities stocks outperformed all major S&P 500 sectors, with the Utilities SPDR Select Sector ETF (XLU) gaining nearly 2.5% for the week. International equities continued their recent struggles, as the iShares MSCI Emerging Markets Index ETF (EEM), and the International Developed market iShares MSCI EAFE Index Fund ETF (EFA) closed down nearly 3%.
Fixed Income: The yield on the US 10-Year Treasury Note ended the week little changed, near 2.9%. A Tuesday equity sell-off forced the yield down to 2.85%, but it was a relatively tame move as the 10-year may have found a near-term equilibrium level. High-yield spreads over the corresponding risk-free securities remain near 3.5% to close the week on the lower end of this year’s range. A US dollar roll-over may have signaled a top and helped Emerging Market bonds find relative relief, with the VanEck Vectors JP Morgan Emerging Market Local Currency Bond ETF (EMLC) up around .5% for the week.
Commodities: Oil prices were relieved from their holding pattern after the highly anticipated OPEC meeting resulted in an agreement to increase to the self-imposed production limits by 1 million barrels per day. The news was bullish for prices, as the Saudi Energy Minister said that the more realistic increase will be near 600,000 barrels per day. The American benchmark West Texas Intermediate jumped over 5% on Friday to close near $69 per barrel, while Brent Crude ended the week near $75.45. Natural Gas prices pulled back slightly to close the week at $2.95/MMBtu.
WEEKLY ECONOMIC SUMMARY
Housing Starts: Housing starts for the month of May came in at the high end of the consensus range, up nearly 5% from the prior month’s revised seasonally adjusted annualized rate of 1.286 million to 1.35 million. The acceleration of both single-family and multi-family home construction is a welcome sign for markets in desperate need of supply, and should help boost 2nd quarter GDP. However, the number of new building permits fell for a second month in a row, which may be an ominous sign for the housing industry from this leading economic indicator.
Jobless Claims: New jobless claims unexpectedly fell below the consensus estimate of 220,000 for the measurement period, to 218,000. New claims for the previous period were revised higher from 218,000 to 221,000, but the more stable 4-week average of new claims fell to 221,000. Consistent with low unemployment and tight labor conditions, the 4-week moving average of continuing claims remains near all-time lows at 1.723 million, with those looking for a job generally being able to find one.
Philadelphia Fed: The June Business Outlook Survey, conducted by the Philadelphia Federal Reserve, dropped far below the consensus estimate of 28 and even further below the extremely strong reading of 34.4 in May. The headline number of 19.9 is a year-and-a-half low, but is still far above “0”, indicating continued favorable conditions in the regional manufacturing sector. The new-orders index fell along with expectations for activity in the next 6 months. Effects from tariffs levied by the escalating trade war may yet to be reflected in economic data, but are being anticipated by many in the sensitive manufacturing sector. We should get a clearer picture when the Institute of Supply Management (ISM) releases their results on June 2nd.
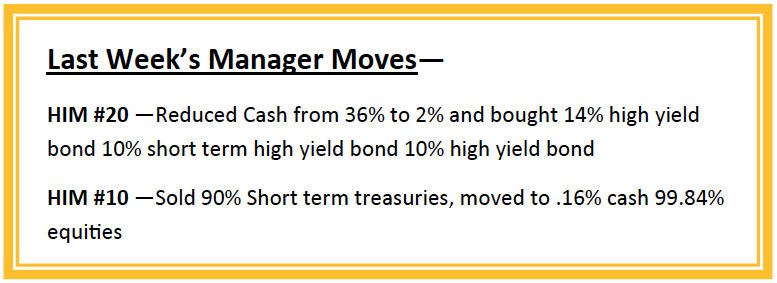
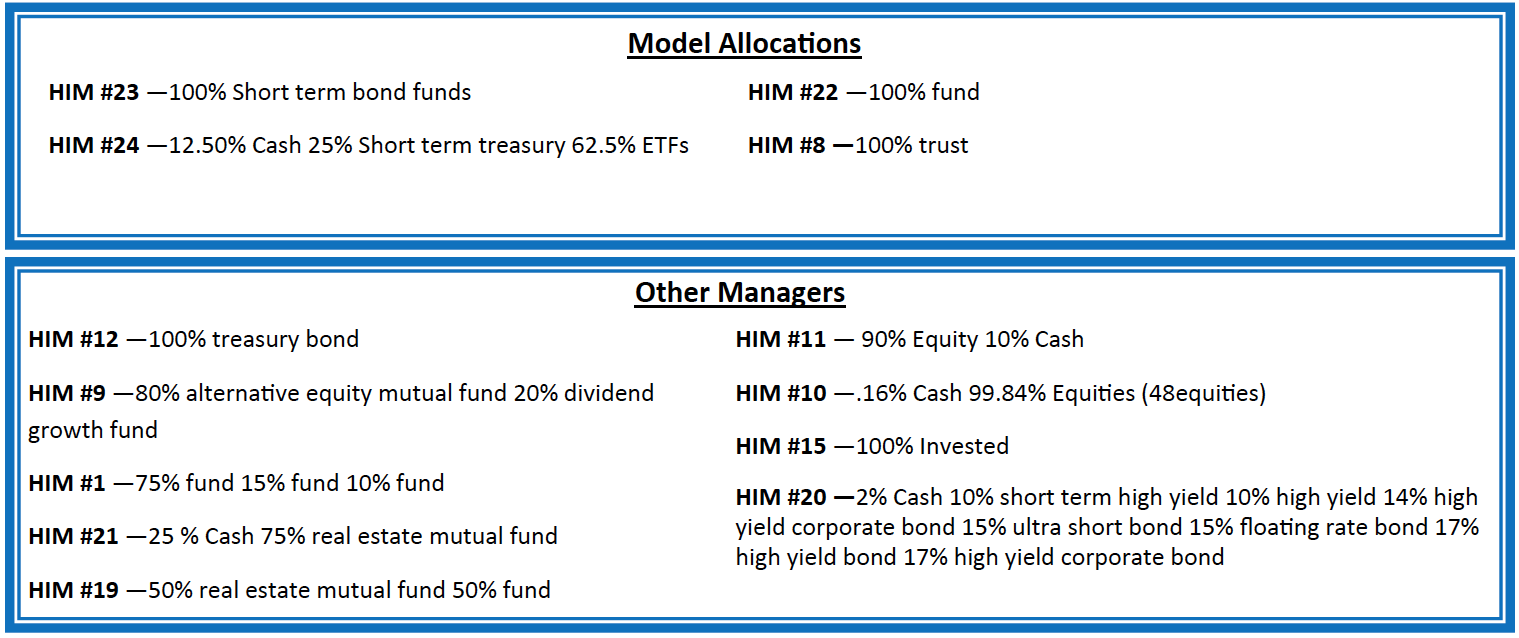
Current Model Allocations
Summary
In utilizing an approach that seeks to limit volatility, it is important to keep perspective of the activity in multiple asset classes. We seek to achieve superior risk-adjusted returns over a full market cycle to a traditional 60% equities / 40% bonds asset allocation. We do this by implementing global mandates of several tactical managers within different risk buckets. For those investors who are unwilling to stomach anything more than minimal downside risk, our goal is to provide a satisfying return over a full market cycle compared to the Barclays Aggregate Bond Index. At Horter Investment Management we realize how confusing the financial markets can be. It is important to keep our clients up to date on what it all means, especially with how it relates to our private wealth managers and their models. We are now in year nine of the most recent bull market, one of
the longest bull markets in U.S. history. At this late stage of the market cycle, it is extremely common for hedged managers to underperform, as they are seeking to limit risk. While none of us know when a market correction will come, even though the movement and volatility sure are starting to act like a correction, our managers have been hired based on our belief that they can accomplish a satisfying return over a full market cycle, — while limiting risk in comparison to a traditional asset allocation approach. At Horter we continue to monitor all of the markets and how our managers are actively managing their portfolios. We remind you there are opportunities to consider with all of our managers. Hopefully this recent market commentary is helpful and thanks for your continued trust and loyalty.