HORTER INVESTMENT MANAGEMENT, LLC
Weekly Commentary horterinvestment.com April 1, 2019
What the Yield Curve Inversion Really Means
The professor who first identified yield curve inversions has written an article explaining what the development really means. First identified in 1986, a yield curve inversion is considered the most widely accurate indicator of recession. Since it was first identified and back tested, it has accurately predicted a further 3 out of 3 recessions. This is a point its “discoverer” Campbell Harvey hammers home in his article. He explains that an inversion is usually followed by a recession within 12-18 months. The yield curve has not been inverted since before the Crisis, but just did so on Friday.

The Fed has made a big mistake, and here’s how Powell could fix it: Stifel
Fears of a global recession are on the rise, part of the yield curve has inverted and earnings are expected to slow this year. With all that, it’s starting to look like the Federal Reserve has made a big mistake, said Barry Bannister, Stifel’s head of U.S. equity strategy.
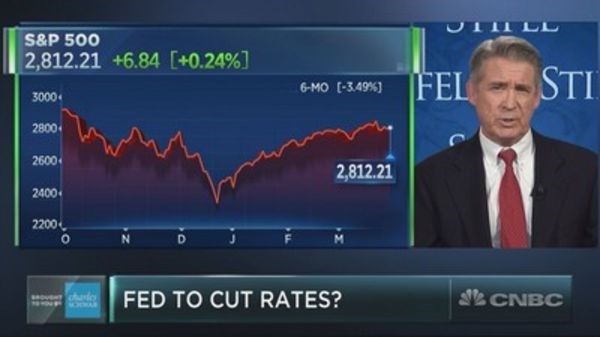
“The economy is about six months after Fed action. The Fed over-hiked by twice in the fourth quarter and that was really part and parcel why we had such a big sell-off. The economic effect of that is going to show up towards mid-year,” Bannister said Thursday on “Trading Nation.”
The Federal Open Market Committee last raised rates by a quarter point in December, boosting the benchmark funds rate to a range of 2.25 percent to 2.5 percent. That marked the fourth rate increase since Jerome Powell assumed the chair. At the December meeting, it also forecast two hikes in 2019.

Taking a comprehensive look at the overall current stock market
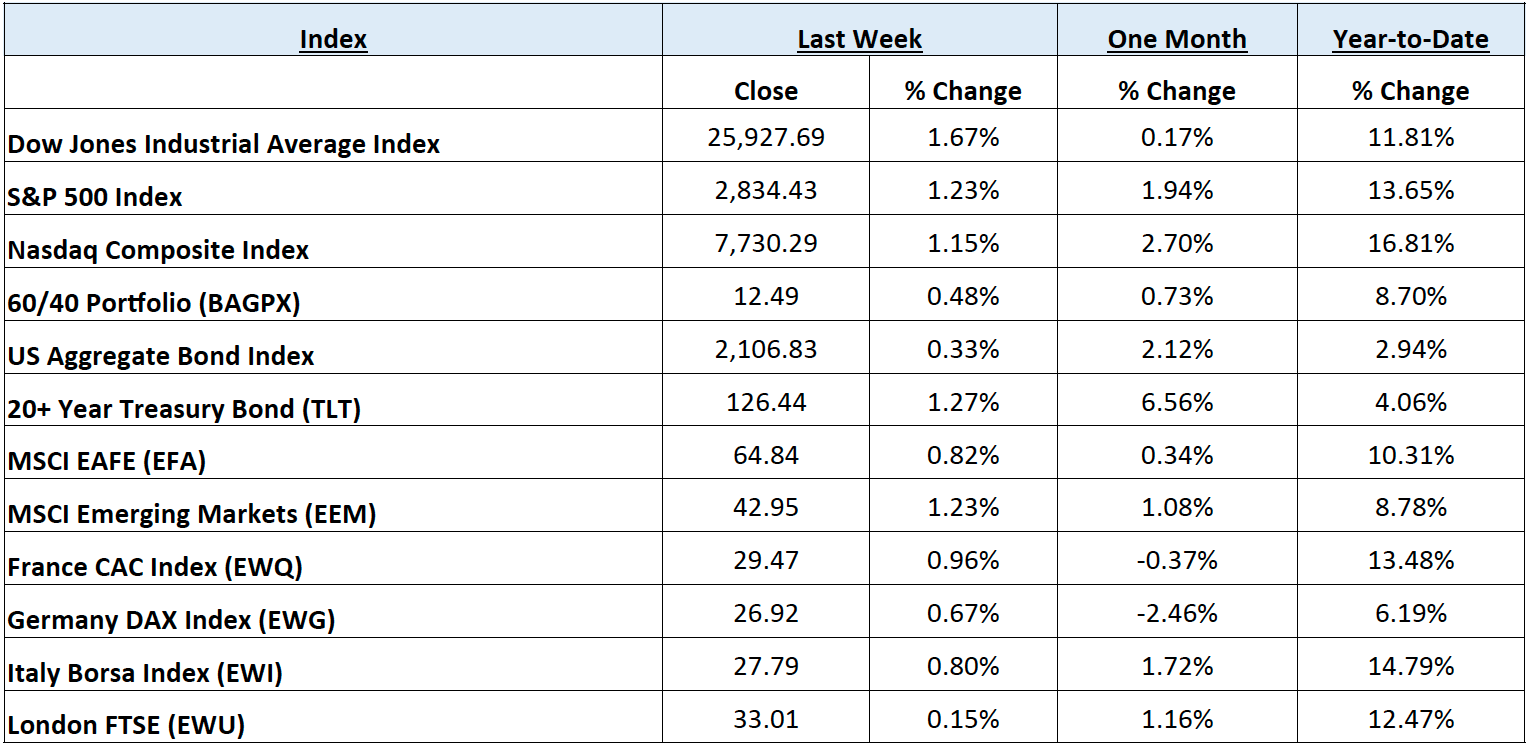
Taking a comprehensive look at the overall current stock market, you can see the chart below representing eight major indices and their returns through the week ending March 29, 2019. In a truly diversified portfolio, the portfolio’s total return is determined by the performance of all of the individual positions in combination – not individually.
So, understanding the combined overall performance of the indices below, simply average the 12 indices to get a better overall picture of the market. The combined average of all 12 indices is 10.33% year to date.
Data Source: Investors FastTrack, Yahoo Finance, Investopedia
Past performance is not a guarantee of future results. This Update is limited to the dissemination of general information pertaining to its investment advisory services and is not suitable for everyone. The information contained herein should not be construed as personalized investment advice. There is no guarantee that the views and opinions expressed in this newsletter will come to pass. Investing in the stock and bond markets involves gains and losses and may not be suitable for all investors. Information presented herein is subject to change without notice. Horter has experienced periods of underperformance in the past and may also in the future. The returns represented herein are total return inclusive of reinvesting all interest and dividends.
The above equity, bond and cash weightings are targets and may not be the exact current weightings in any particular client account. Specifically, there may be cases where accounts hold higher cash levels than stated in these target weightings. This is usually to accommodate account level activity. Furthermore, some variable annuity and variable universal life accounts may not be able to purchase the exact weightings that we are indicating above due to specific product restrictions, limitations, riders, etc. Please refer to your client accounts for more specifics or call your Horter Investment Management, LLC at (513) 984-9933.
Investment advisory services offered through Horter Investment Management, LLC, a SEC-Registered Investment Advisor. Horter Investment Management does not provide legal or tax advice. Investment Advisor Representatives of Horter Investment Management may only conduct business with residents of the states and jurisdictions in which they are properly registered or exempt from registration requirements. Insurance and annuity products are sold separately through Horter Financial Strategies, LLC. Securities transactions for Horter Investment Management clients are placed through E*TRADE Advisor Services, TD Ameritrade and Nationwide Advisory Solutions.
For additional information about Horter Investment Management, LLC, including fees and services, send for our disclosure statement as set forth on Form ADV from Horter Investment Management, LLC using the contact information herein. Please read the disclosure statement carefully before you invest or send money.
Dow Jones – Week Ending
WEEKLY MARKET SUMMARY
Global Equities: Positive news from US officials regarding the trade negotiations that took place over two days in Beijing helped US and emerging market equities advance at the end of the week. Progress on the issue of forced technology transfer and expanding access to US businesses in China highlighted the progress that is expected to continue when Chinese officials arrive in Washington next week. The Dow Jones Industrial Average led the three major US indices, with a gain of 1.67%, as the Industrial sector represented by the SPDR Select Sector Industrial ETF (XLI) gained a sector-leading 2.85% on the week. The S&P 500 Index gained 1.23% and the Nasdaq Composite returned 1.13%. The defensive Utility sector lagged, with the SPDR Select Sector Utilities ETF (XLU) down nearly 1% on the week. Developed International stocks represented by the iShares MSCI EAFE Index Fund ETF (EFA) gained 0.86%, while Emerging Markets represented by the iShares MSCI Emerging Market Index ETF (EEM) gained 1.15% as Chinese equities rallied on the trade news.
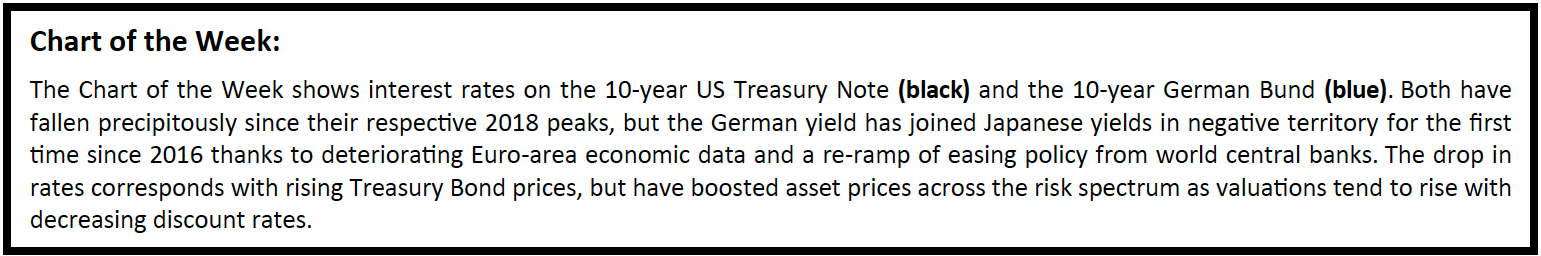
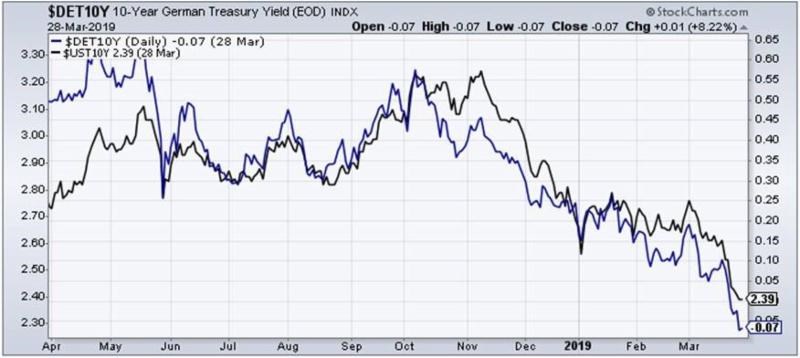
Fixed Income: The 10-year US Treasury Note yield dropped to a new 52-week low, hitting 2.36% during the week, before settling mostly unchanged from the prior week at 2.44%. The European Central Bank president Mario Draghi, while speaking to a conference in Frankfurt, spoke about deterioration in external demand and noted heightened downside risks which caused the yield on the 10-year German Bund to decline further into negative territory. The interest rate spread on high yield bond over equivalent Treasury securities widened slightly, even as the iShares IBoxx High Yield Corporate Bond ETF (HYG) managed a 0.72% gain on the week. Lipper reported net inflows into high yield funds of $590 million for the week ended 3/27.
Commodities: Oil prices continue to be highly correlated to equity prices, rising nearly 2% on the week, with the West Texas Intermediate (WTI) benchmark posting its best quarter since 2009. This, despite President Trump again attacking OPEC via twitter about oil prices being too high, as the group sustains production cuts to support prices. OPEC are likely to ignore the President’s tweets, with WTI rising to $60.86 per barrel, and the International Brent crude benchmark up to $68.66 per barrel. Natural gas prices slipped again, losing nearly 3%, to $2.67/MMBtu.
WEEKLY ECONOMIC SUMMARY
Gross Domestic Product (GDP): The third and final estimate for 4th quarter US Real GDP was revised down to an annualized 2.2%, down from the prior estimate of 2.6%. Business investment grew at a still very strong rate of 5.4% after a lower revision. Consumer spending was still the driver with favorable metrics for services and goods, both durable and non-durable. A lower revision of the already weak residential investment segment combined with government purchases to drag down growth during the quarter. The price index was revised slightly lower, from 1.8% to 1.7%, highlighting that the US is affected by the general lack of inflation globally.
Consumer Confidence: The Consumer Confidence Index, released by the Conference Board, fell to 124.1 for March from the prior reading of 131.4. The drop was unexpected, with consensus estimates of 133, with many economists expecting a continued rebound from the weak January number stemmed from the government shutdown. This month, there was weakness in respondents’ outlook for the job market, as those saying jobs were plentiful dropped by 3.7%. Also, participants who say the economy is bad right now rose 2.5%, to 13.6% of respondents. Buying plans did tick up, however, as those expecting to purchase a car or a home in the next 12 months jumped 1.7% and 0.7%, respectively.
MBA Mortgage Applications: Lower interest rates this year has reignited mortgage applications for potential home buyers and those looking to refinance, according to the Mortgage Bankers Association (MBA). The headline composite index rose 8.9% week-on-week for the period ended March 22, while those looking to purchase rose a healthy 6% and 4% year-on-year. The Refinancing Index surged 12% on the week as the average 30-year mortgage rate dropped another 0.10% to 4.45% for conforming mortgages.
Current Model Allocations
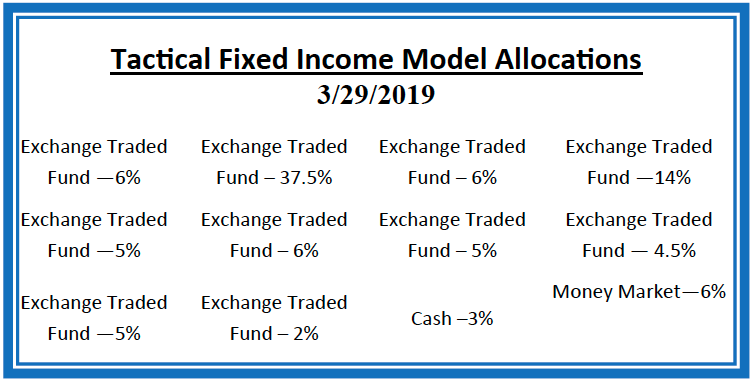
Data Source: Hanlon Investment Management 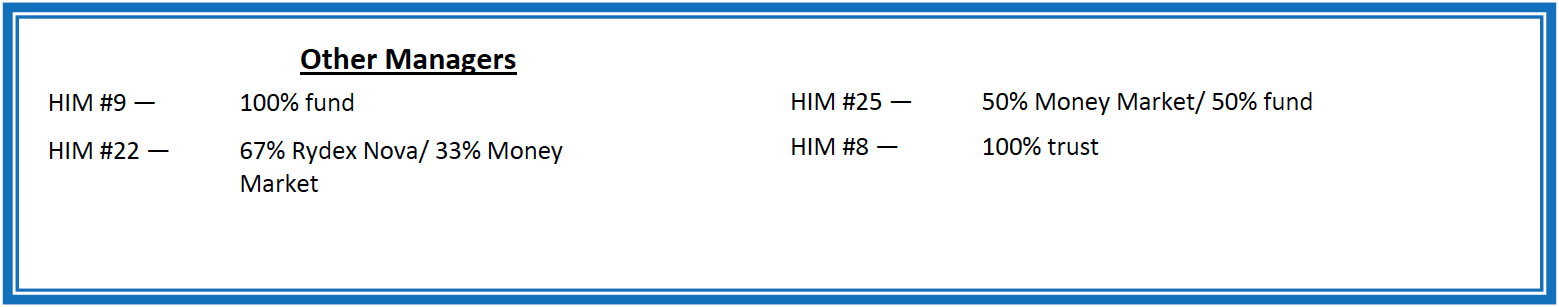
Summary
In utilizing an approach that seeks to limit volatility, it is important to keep perspective of the activity in multiple asset classes. We seek to achieve superior risk-adjusted returns over a full market cycle to a traditional 60% equities / 40% bonds asset allocation. We do this by implementing global mandates of several tactical managers within different risk buckets. For those investors who are unwilling to stomach anything more than minimal downside risk, our goal is to provide a satisfying return over a full market cycle compared to the Barclays Aggregate Bond Index. At Horter Investment Management we realize how confusing the financial markets can be. It is important to keep our clients up to date on what it all means, especially with how it relates to our private wealth managers and their models. We are now in year nine of the most recent bull market, one of
the longest bull markets in U.S. history. At this late stage of the market cycle, it is extremely common for hedged managers to underperform, as they are seeking to limit risk. While none of us know when a market correction will come, even though the movement and volatility sure are starting to act like a correction, our managers have been hired based on our belief that they can accomplish a satisfying return over a full market cycle, – while limiting risk in comparison to a traditional asset allocation approach. At Horter we continue to monitor all of the markets and how our managers are actively managing their portfolios. We remind you there are opportunities to consider with all of our managers. Hopefully this recent market commentary is helpful and thanks for your continued trust and loyalty.
Data Source: Hanlon Investment Management