


Rates Move Higher and Steeper, US Treasury Rates Bizarre
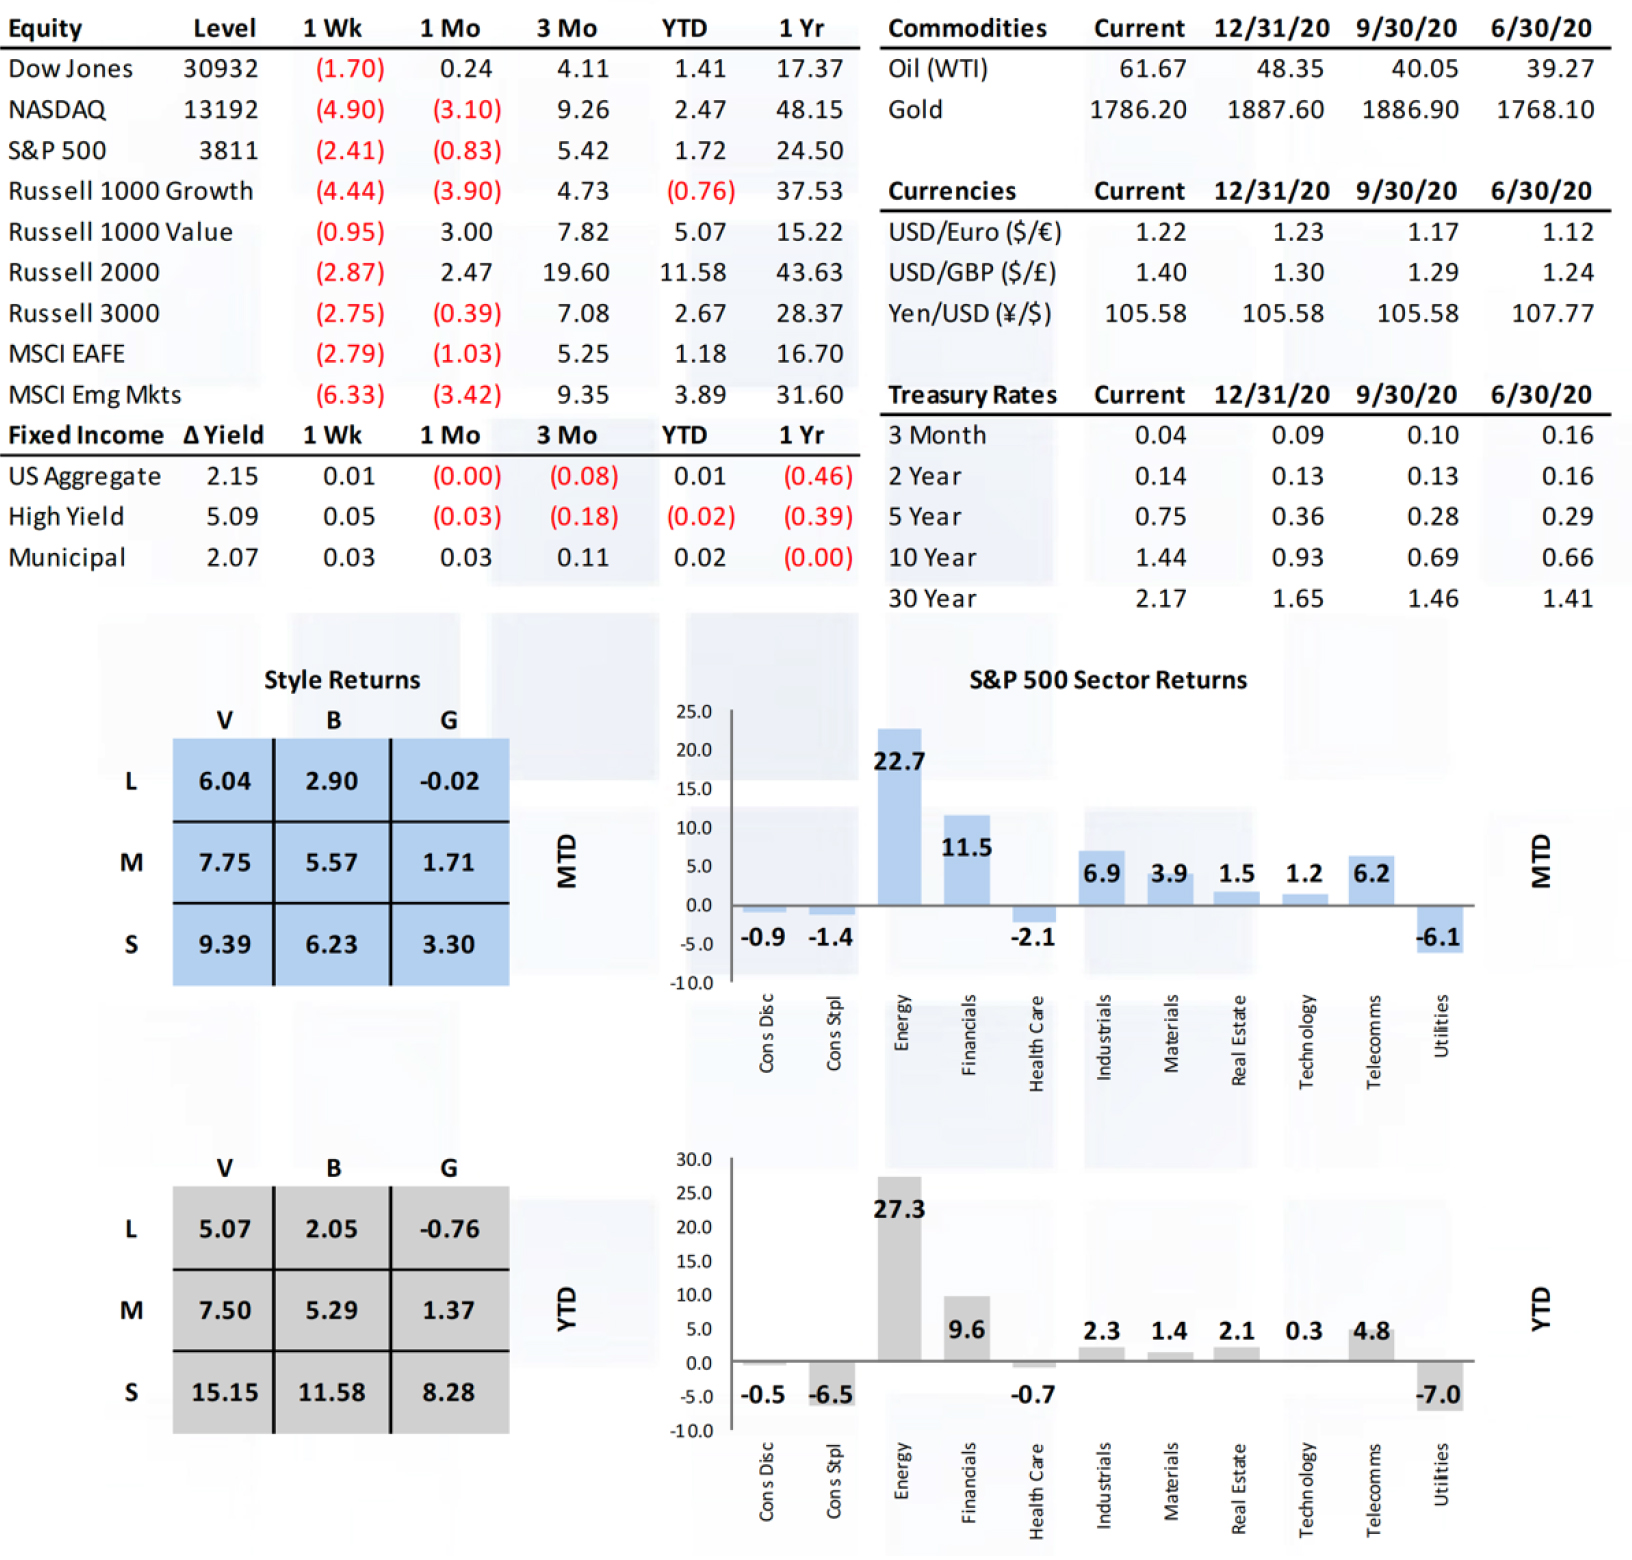
Rates moved both higher and steeper again last week. Curve steepening has been pronounced with the 2-10 at 1.30% and the
3m-10 at 1.40%. While bonds are oversold in the short term, the long-term trend line should eventually take yields up to the 2.0%-2.5% area.
• We saw some very bizarre US Treasury rate action last week. Tuesday saw 2 year and 30 year fractionally higher while 5 year and 10year were lower. The shortest (1bps) and longest (3bps) maturities did not move too much while 5 year were up 16bps and 10 year & 20 year were up only 10bps. A clear kink in the curve.
• Momentum and technology stocks are bearing the weight of the rise in yields. MTUM, a proxy for the broad momentum factor across the US equity market, was down over 5% across 5 days which is only the second time it has reached that degree of a selloff since March.
• Central bankers on both sides of the Atlantic did their best to assure markets last week. Powell reiterated the Fed’s commit- ment to explicit forward guidance to the Senate Banking Committee and offered reassuring views on inflation and the rise
in yields. Lagarde and Schnabel also made clear the ECB will ensure there will be no unwarranted tightening of financing condi- tions.
• In the past, dovish braying and big QE helped stocks AND bonds but recently markets have been behaving as if there has been a shift in market psychology translat- ing to a change in bond yield to stock price correlation.
• Inflation remained a key focus of market participants last week. BCA noted West Texas Intermediate prices rising 70% since October alongside correlation data between gasoline prices and headline inflation.
• In a separate research note, BCA ad-dressed several myths surrounding 1970’s style inflation relative to today.
• Strategas reiterated confidence in the overall market due to continued internal market dynamics such as reopening pairs, BB/BBB spreads, CD vs CS, high beta vs low beta, advance/decline ratios, and cycli-cal sector performance.
• The $1.9t stimulus package passed the HOR and is heading to the Senate. Strategas estimates approximately $700b of consumer related stimulus will hit within the next six months.
Economic Release Highlights
• January Personal Income and Outlays report showed MoM personal income (10% vs 9.4%) and personal consumption (2.4% vs 2.2%) both higher than expected while core PCE was in generally in line with expectations at MoM (0.3% vs 0.1%) and YoY (1.5% vs 1.4%).
• December’s Case-Shiller Home Price Index rose more than expected for a second consecutive month at MoM (1.3%a vs 1.0%e) and YoY (10.1%a vs 9.6%e).
• New (923k vs 855k) and Pending
(-2.8%a vs 0%e) Home Sales were mixed with new exceeding pending continuing to lag.
• Conference Board Consumer Confi-dence for February came in higher than expected (91.3 vs 90.0) but remained somewhat subdued.
• The final UofM Consumer Sentiment for February remained at the relatively subdued level of 76.8a vs 76.4e.
• January Durable Goods Orders acceler-ated faster than expected (3.4% vs 1.1%), well over December’s 0.5%, providing further evidence of an upward trending manufacturing cycle.
Investment Advisory Services are offered through Virtue Capital Management, LLC, an SEC Registered Investment Adviser. This newsletter is not to give investment advice. Before investing in any advisory product please carefully read any disclosure documents, including without limitation, the firm’s Form ADVs. Indices do not reflect the deduction of any fees or expenses. They are not available for direct investment. Exposure to an asset class represented by an index is available through investable instruments based on that index. The Dow Jones Industrial Average (DJIA) is a price-weighted average of 30 significant stocks traded on the New York Stock Exchange (NYSE) and the Nasdaq. The DJIA was designed to serve as a proxy for the broader U.S. economy. The Nasdaq Composite Index is the market capitalization-weighted index of over 3,300 common equities listed on the Nasdaq stock exchange. It is used as a broad-based market index. The S&P 500 index is designed to be a broad based unmanaged leading indicator of U.S. equities and is meant to reflect the risk/return characteristics of the large cap universe or representative of the equity market in general. The Russell 3000® Index measures the performance of the largest 3000 U.S. companies representing approximately 98% of the investable U.S. equity market. Total Return assumes dividends are reinvested. The Russell 1000 is a subset of the Russell 3000 Index. It represents the top companies by market capitalization. The Russell 1000 measures the performance of those Russell 1000 companies with higher price-to-book ratios and higher forecasted growth values. The Russell 2000 index is an index measuring the performance of approximately 2,000 small-cap companies in the Russell 3000 Index, which is made up of 3,000 of the biggest U.S. stocks. The Russell 2000 serves as a benchmark for small-cap stocks in the United States. Visit www.russell.com/indexes/ for more information regarding Russell indices. The MSCI EAFE Index is a free float-adjusted market capitalization index that is designed to measure the equity market performance of developed markets, excluding the US & Canada. The MSCI Emerging Markets Index is a free float-adjusted market capitalization index that is designed to measure equity market performance in the global emerging markets. The information published herein is provided for informational purposes only, and does not constitute an offer, solicitation or recommendation to sell or an offer to buy securities, investment products or investment advisory services. Nothing contained herein constitutes financial, legal, tax, or other advice. These opinions may not fit your financial status, risk and return profile or preferences. Investment recommendations may change, and readers are urged to check with their investment adviser before making any investment decisions. Estimates of future performance are based on assumptions that may not be realized. Past performance is not necessarily indicative of future returns or results. No representation is made as to the accuracy, completeness or timeliness of the information in this material since certain information herein is based on or derived from information provided by independent third-party sources. All enclosed material including market analysis data provided Taiber Kosmala & Associates, LLC. There is no duty to update this information. The Wilshire 5000 Total Market Index represents the broadest index for the U.S. equity market, measuring the performance of all U.S. headquartered equity securities with readily available price data. The PHLX Semiconductor Sector Index (SOX) is a capitalization-weighted index composed of 30 semiconductor companies. The companies in the Index have primary business operations that involve the design, distribution, manufacture and sale of semiconductors. The index is designed to track the performance of listed semiconductors. The Case-Shiller Index, formally known as the S&P/Case-Shiller Home Price Index is made up of several indexes that track the value of single-family detached residences using the arms-length and repeat-sales methods. It is used as a barometer not just of the housing market, but also of the health of the broader economy. For more information on the index, please visit https://www.spglobal.com/. All information obtained from Taiber Kosmala & Associates (2020. The secured overnight financing rate (SOFR) is a benchmark interest rate for dollar-denominated derivatives and loans that is replacing the London interbank offered rate (LIBOR). Interest rate swaps on more than $80 trillion in notional debt switched to the SOFR in October 2020.

