
Equity Markets Climb the Steep Wall of Worry.
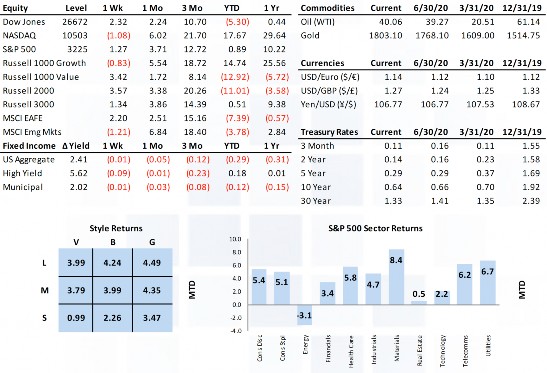
Equity markets climbed the wall of worry last week, finishing up 1%-3% across the cap spectrum. The push-pull of the virus, positive vaccine news, and rebounding economic data left the S&P right at the resistance level that it has held since early June. Healthcare and the cyclicals drove the rally with some interesting internals where tech and consumer discretionary actually lost ground in an up week. Commodities and rates were both flat on the week, but the USD again lost ground (0.73%). Fiscal policy is front and center beginning Monday as team D and team R enter into negotiations on one of the biggest pillars underpinning the financial market recovery (policy).
Market Anecdotes
• Last week’s move in the S&P 500 brought it back to flat for the year, now +47.12% from the March 23rd low and less than 5% from the February 19th closing high.
• The 2Q earnings season kicked into full gear last week with only 9% of S&P 500 names reporting so far. Blended earnings and revenue growth rates stand at -44% and -10.5% respectively. • Bespoke noted an important distinction between U.S. and European (Stoxx 600) market composition with the U.S. clearly more top-heavy (23.56%) and tech-oriented whereas the Stoxx 600 is less top-heavy (8.84%) and more diversified across pharma, food, and tech.
• Both positive and concerning CoVid-19 developments last week. Encouraging vaccine news offset by concerning hospital loads and the Rt number moving back over 1 in 42 of 50 states.
• The three-month annualized deficit through June is running at 40% of GDP due to a surge in outlays and an evaporation of tax revenues.
• Last week saw ample cooing from the Fed with more talk of yield curve control (YCC) and more aggressive long-term forward guidance. Inflation expectations, as measured by 10yr real UST yields are approaching record lows at -0.87%.
• One clear result of Fed activity is the MOVE index. We are seeing extreme low implied volatility readings across UST futures, actually ranking in the bottom 0.5% of all readings.
• The Fed’s 4.18t UST holdings are now greater than all other foreign central banks combined.
• Longer-term forward breakevens (5y5y) trade around 1.4%, with some swings back and forth but a rock-solid sideways trend over the last 3 months.
Economic Release Highlights
• June retail sales grew 7.5%, an expected moderation from the stimulus enhanced May number but strong growth across both headline and core measures.
• Housing starts (1.186mm vs 1.190mm) and building permits (1.241mm vs 1.294mm) were both near estimates and increased over the prior month. NAHB home builder sentiment rose from 58 to 72 as homebuilding rose in June by the most in four years.
• June industrial production moved higher by 5.4% (4.4% expected). The manufacturing sub-component jumped by 7.2% (5.5% expected).
• The NFIB Small Business Optimism index came in higher than expectations (100.6 vs 97.8), moving back above 100 and well above the 94.4 reading last month. • UofM consumer sentiment declined to 73.2 from 78.1 last week. Headline, current conditions, and future expectations all declined, now in the bottom 20% of all readings since 1978.
• The July reading from the NY Fed manufacturing index delivered a third consecutive monthly increase, its first expansionary reading of the crisis, and registering its highest level since November 2018. The Philly Fed general conditions index declined however from 27.5 to 24.1.
• Weekly jobless claims declined for a fifteenth consecutive week but posted the smallest sequential decline (1.3mm from 1.301mm) since the recovery began.
• June headline and core CPI rose by 0.6% and 1.2% respectively, and nobody cares.
INSIGHT
MARKET ANALYSIS