Stimulus Push Benefits Risk Markets Early.

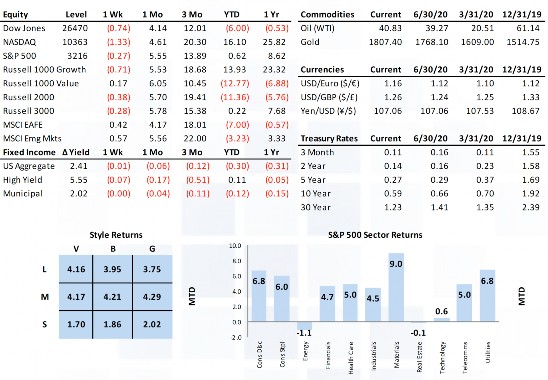
Risk markets benefited early in the week from another stimulus push. Encouraging reports on three potential coronavirus vaccines resulting in the S&P 500 marking a new post-CoVid-19 high but ended up limping into the weekend on concerns surrounding stimulus negotiations in DC and some unfavorable earnings from several technology names. Tech and communication services (FB, GOOG, NFLX) were particularly soft last week while cyclical sectors posted healthy gains. Commodities posted gains as oil moved over $41 while the USD and interest rates moved lower.

Market Anecdotes

• FactSet’s blended 2Q S&P 500 earnings growth rate stands at -42% and revenue growth of -10.1%. Beat rates and forward guidance (spread of +10%) have also been encouraging.
• Last week saw an interesting and forceful rotation in market internals as Tues/Wed/Thurs was the largest 3-day outperformance for value over growth since May of 2001.
• A primary driver of risk markets early last week were positive developments from an extended EU summit resulting in a €1.8 trillion stimulus package.
• Another interesting market internal last week were clear signs of healthy market breadth despite the decline in the headline indices.
• CDS saw a 1 standard deviation move in credit spreads in both Europe and the U.S., confirming stock market behavior early in the week.
• Silver jumped 17% last week alone, buoyed by the weak USD and increasing industrial demand expectations resulting from the global economic recovery.
• Vaccines under development from Oxford, Astra-Zeneca, Pfizer, and BioNTech, and CanSino Biologics all reported encouraging results (responses) in limited human trials.
• An outlook for a structurally weak USD and emergence of cyclical leadership globally make a case for overweight international equities over U.S. equities over a 12-36 month timeframe.
• Bespoke made note of some encouraging observations from the Atlanta Fed’s weekly update of business applications which have been rising rapidly in sympathy with the CoVid-19 recovery.

Economic Release Highlights

• June existing home sales of 4.72mm (+21% MoM) showed improvement and was in line with expectations. New home sales figures were very impressive and crushed expectations.
• Markit flash PMIs (C, M, S) in the U.S. (50, 51.3, 49.6), EZ (54.8, 51.1, 55.1), and Japan (43.9, 42.6, 45.2) have shown clear improvement and are in or drawing closer to expansionary readings.
• Weekly jobless claims of 1.416mm rose WoW for the first time since March and came in higher than expectations. Continuing claims dropped for a seventh consecutive week, by over 1mm, to 16.197mm.
• The weekly AAII Bull-Bear spread remained in negative territory (-20.7%) for a 22nd consecutive week, now tied for the longest net negative reading on record.

W E E K E N D I N G 7 / 2 4 / 2 0

INSIGHT
MARKET ANALYSIS

Equity Markets Climb the Steep Wall of Worry.

Equity markets climbed the wall of worry last week, finishing up 1%-3% across the cap spectrum. The push-pull of the virus, positive vaccine news, and rebounding economic data left the S&P right at the resistance level that it has held since early June. Healthcare and the cyclicals drove the rally with some interesting internals where tech and consumer discretionary actually lost ground in an up week. Commodities and rates were both flat on the week, but the USD again lost ground (0.73%). Fiscal policy is front and center beginning Monday as team D and team R enter into negotiations on one of the biggest pillars underpinning the financial market recovery (policy).

Market Anecdotes

• Last week’s move in the S&P 500 brought it back to flat for the year, now +47.12% from the March 23rd low and less than 5% from the February 19th closing high.
• The 2Q earnings season kicked into full gear last week with only 9% of S&P 500 names reporting so far. Blended earnings and revenue growth rates stand at -44% and -10.5% respectively. • Bespoke noted an important distinction between U.S. and European (Stoxx 600) market composition with the U.S. clearly more top-heavy (23.56%) and tech-oriented whereas the Stoxx 600 is less top-heavy (8.84%) and more diversified across pharma, food, and tech.
• Both positive and concerning CoVid-19 developments last week. Encouraging vaccine news offset by concerning hospital loads and the Rt number moving back over 1 in 42 of 50 states.
• The three-month annualized deficit through June is running at 40% of GDP due to a surge in outlays and an evaporation of tax revenues.
• Last week saw ample cooing from the Fed with more talk of yield curve control (YCC) and more aggressive long-term forward guidance. Inflation expectations, as measured by 10yr real UST yields are approaching record lows at -0.87%.
• One clear result of Fed activity is the MOVE index. We are seeing extreme low implied volatility readings across UST futures, actually ranking in the bottom 0.5% of all readings.
• The Fed’s 4.18t UST holdings are now greater than all other foreign central banks combined.
• Longer-term forward breakevens (5y5y) trade around 1.4%, with some swings back and forth but a rock-solid sideways trend over the last 3 months.

Economic Release Highlights

• June retail sales grew 7.5%, an expected moderation from the stimulus enhanced May number but strong growth across both headline and core measures.
• Housing starts (1.186mm vs 1.190mm) and building permits (1.241mm vs 1.294mm) were both near estimates and increased over the prior month. NAHB home builder sentiment rose from 58 to 72 as homebuilding rose in June by the most in four years.
• June industrial production moved higher by 5.4% (4.4% expected). The manufacturing sub-component jumped by 7.2% (5.5% expected).
• The NFIB Small Business Optimism index came in higher than expectations (100.6 vs 97.8), moving back above 100 and well above the 94.4 reading last month. • UofM consumer sentiment declined to 73.2 from 78.1 last week. Headline, current conditions, and future expectations all declined, now in the bottom 20% of all readings since 1978.
• The July reading from the NY Fed manufacturing index delivered a third consecutive monthly increase, its first expansionary reading of the crisis, and registering its highest level since November 2018. The Philly Fed general conditions index declined however from 27.5 to 24.1.
• Weekly jobless claims declined for a fifteenth consecutive week but posted the smallest sequential decline (1.3mm from 1.301mm) since the recovery began.
• June headline and core CPI rose by 0.6% and 1.2% respectively, and nobody cares.

W E E K E N D I N G 7 / 1 7 / 2 0

INSIGHT
MARKET ANALYSIS

4th of July Week Markets End With a Healthy Bang.

Fourth of July fireworks continued into last week with strong bookends (M&F) delivering healthy gains driven once again by larger cap and tech-oriented names. The S&P 500 finished up 1.8% while small caps lost 0.64%. Strength at the top end of the market cap weighted S&P 500 continued to be pronounced. Commodities posted a respectable 1.52% gain on the back of a rally in industrial and precious metals (WTI was flat). Neither rates nor credit spreads moved meaningfully either way but the USD lost ground for a third consecutive week.

Market Anecdotes

• FactSet reports the estimated 2Q earnings decline is -44.6% which, if met, would mark the largest year-over-year decline in earnings reported by the index since Q4 2008 (-69.1%). The forward 12-month P/E ratio for the S&P 500 is 21.8.
• BCA made an interesting case that combining analysts’ expected temporary decline in earnings with the actual decline in real bond yields translates to a 15% increase in S&P 500 fair value since 12/31/19.
• Bespoke dissected the market rally since March 23 lows into three distinct ‘Acts’, the initial rally (3/23-5/13), the reopening rally (5/13-6/8), and a renewed tech/FAANG rally.
• An amazing testament to the turnaround rally is seen in the NASDAQ 100 (QQQ) which was up 10% on the year into February, collapsed over 30% on CoVid-19 developments in March, then went on to rally to a 20% YTD gain by mid-July.
• Tesla, not even a member of the S&P 500, surpassed Toyota this week as the world’s largest global automobile company (by market cap).
• Citadel indicated retail volume is now approximately 15% of volume but surges to nearly 25% during market peaks.
• Put/call ratio has plummeted since late March leaving the five-day average in the bottom 1% of all readings since 2001, according to Bespoke.
• The Philly SOX made a convincing breakout through prior resistance levels (February and June).
• The NY Fed WEI improved for a tenth consecutive week last week after enduring twelve consecutive weeks of deterioration ending with a new low water mark of -11.48 on April 25th.
• Google search trends (vacation, used car, RV, dentist, hotel, salon) show consumers are ready for some self-care and travel, just not by air or water.
• While we expect posturing aplenty in DC over the next two weeks, we caution investors that it was a mistake to bail in March and every time the debt-ceiling issue came to the forefront in the past.
• U.S. Treasury released details on the PPP last week claiming the program retained over 31mm jobs across a wide range of industries.
• China’s stock market has made both headlines and substantial gains over the past few weeks. The Shanghai Index is +16% over the past 20 days, helped in part by an SOE newspaper making a strong case for domestic investors not to miss out on the ‘bull market.’

Economic Release Highlights

• The June PMI Service index improved from May’s 37.5 read to 47.9, above consensus and outside of the top end of forecasted range.
• June’s ISM Non-Manufacturing Index improved from May’s 45.4 to a 57.1, above consensus and outside of the top end of forecasted range.
• June’s ISM Composite Index jumped to 56.6, its highest level since February 2019.
• May’s JOLTS was expected to show openings falling 3% to 4.9mm (after April’s 16% drop),but instead increased to 5.397mm.


W E E K E N D I N G  7 / 1 0 / 2 0

INSIGHT
MARKET ANALYSIS

NASDAQ Finishes at New Record as Markets Rally.

Markets shrugged off the prior week of rising coronavirus anxiety, instead choosing to embrace encouraging economic reports during last week’s holiday shortened 4-day trading session. The NASDAQ posted its biggest weekly gain since early May, finishing at a new all-time high while the S&P 500 tacked on over 4% with all sectors finishing in the black. Commodity markets benefited from a 5% rally in oil prices which closed over $40, longer term interest rates moved slightly higher, and the USD weakened marginally primarily against commodity currencies.

Market Anecdotes

• Bespoke noted the 33% decline in 33 calendar days leading to March 23rd was followed by a 40% rally in 100 calendar days that followed, the strongest 100-day return since 1933.
• FOMC meeting minutes and the speaking circuit shone a light on conversations surrounding yield curve control and stronger forward guidance on the part of the Fed.
• The impact of recent Fed activity in the financial markets made several headlines last week as they became a top 5 holder of some of the most prevalent publicly traded fixed income ETFs.
• Bespoke made note of the cycle of U.S. to international equity markets, highlighting longer term trends, technical support levels, and fundamental cases for some mean reversion.
• Acceleration of real M1 growth in Europe is consistent with a sharp pickup in economic activity in late 2020 and early 2021. This, combined with better CoVid-19 wave risk management, improves the outlook for European GDP relative to the U.S.
• Pfizer gave markets a boost of Covid19 confidence on positive news surrounding their leading vaccine trials. Globally 17 vaccines are in human trial stages with 130 others in development.
• Don Rissmiller from Strategas suggested Covid-19 recession #1 (March-May) is over, while the lingering effects of high unemployment and economic costs of rolling coronavirus waves pose challenges to the second phase of the business cycle recovery.
• Historically economic shocks lead to surges in nationalism and policy uncertainty. After an unprecedented surge in globalization, conditions in China, India, and Russia may determine the global course more so than the U.S.
• The D’s renewed stimulus proposal is worth $3 trillion, plus an infrastructure bill that nominally amounts to $500 billion over five years.
• BCA projects the U.S. consumer fiscal “cliff” created by the one-time stimulus checks will require close to $1t boost to personal income to prevent falling below February levels.
• The PPP deadline was extended last week to allow more time for businesses to complete registration while the MSLP, launched 6/15, has seen only sparse interest on behalf of lenders.
• U.S. WTI inventories fell 7.2mb last week, far more than the 100,000 forecasted, supporting oil prices in spite of KSI threats of commencing a price war with non-compliant members. Economic Release Highlights
• Consumer confidence jumped from 85.9 to 98.1, far surpassing consensus calls for 90 and improved in both present situation and expectations sub-components.
• April’s Case-Shiller HPI rose 0.3% MoM and 4% YoY, both relatively in line with expectations.
• June’s U.S. PMI manufacturing index jumped to 49.8 from 39.8 the prior month.
• June’s U.S. ISM manufacturing index jumped into expansionary territory of 52.6 from 43.1 the prior month.
• June payrolls of 4.8mm (3.0mm forecasted) followed up May’s shocking upside surprise report of 2.5mm. The unemployment rate dropped to 11.1% from 13.3%.
• Pending home sales in May increased 44.3%, far in excess of the 11.3% expectation.
• AAII weekly sentiment survey registered just a 22.15% bullish reading, a fourth consecutive weekly decline leaving it at its lowest level since October 2019.

INSIGHT
MARKET ANALYSIS

Weekly Newsletter April 1, 2019

Weekly Newsletter March 18, 2019

Weekly Newsletter March 11, 2019

Weekly Newsletter March 4, 2019

Weekly Newsletter February 25, 2019

Weekly Newsletter February 11, 2019