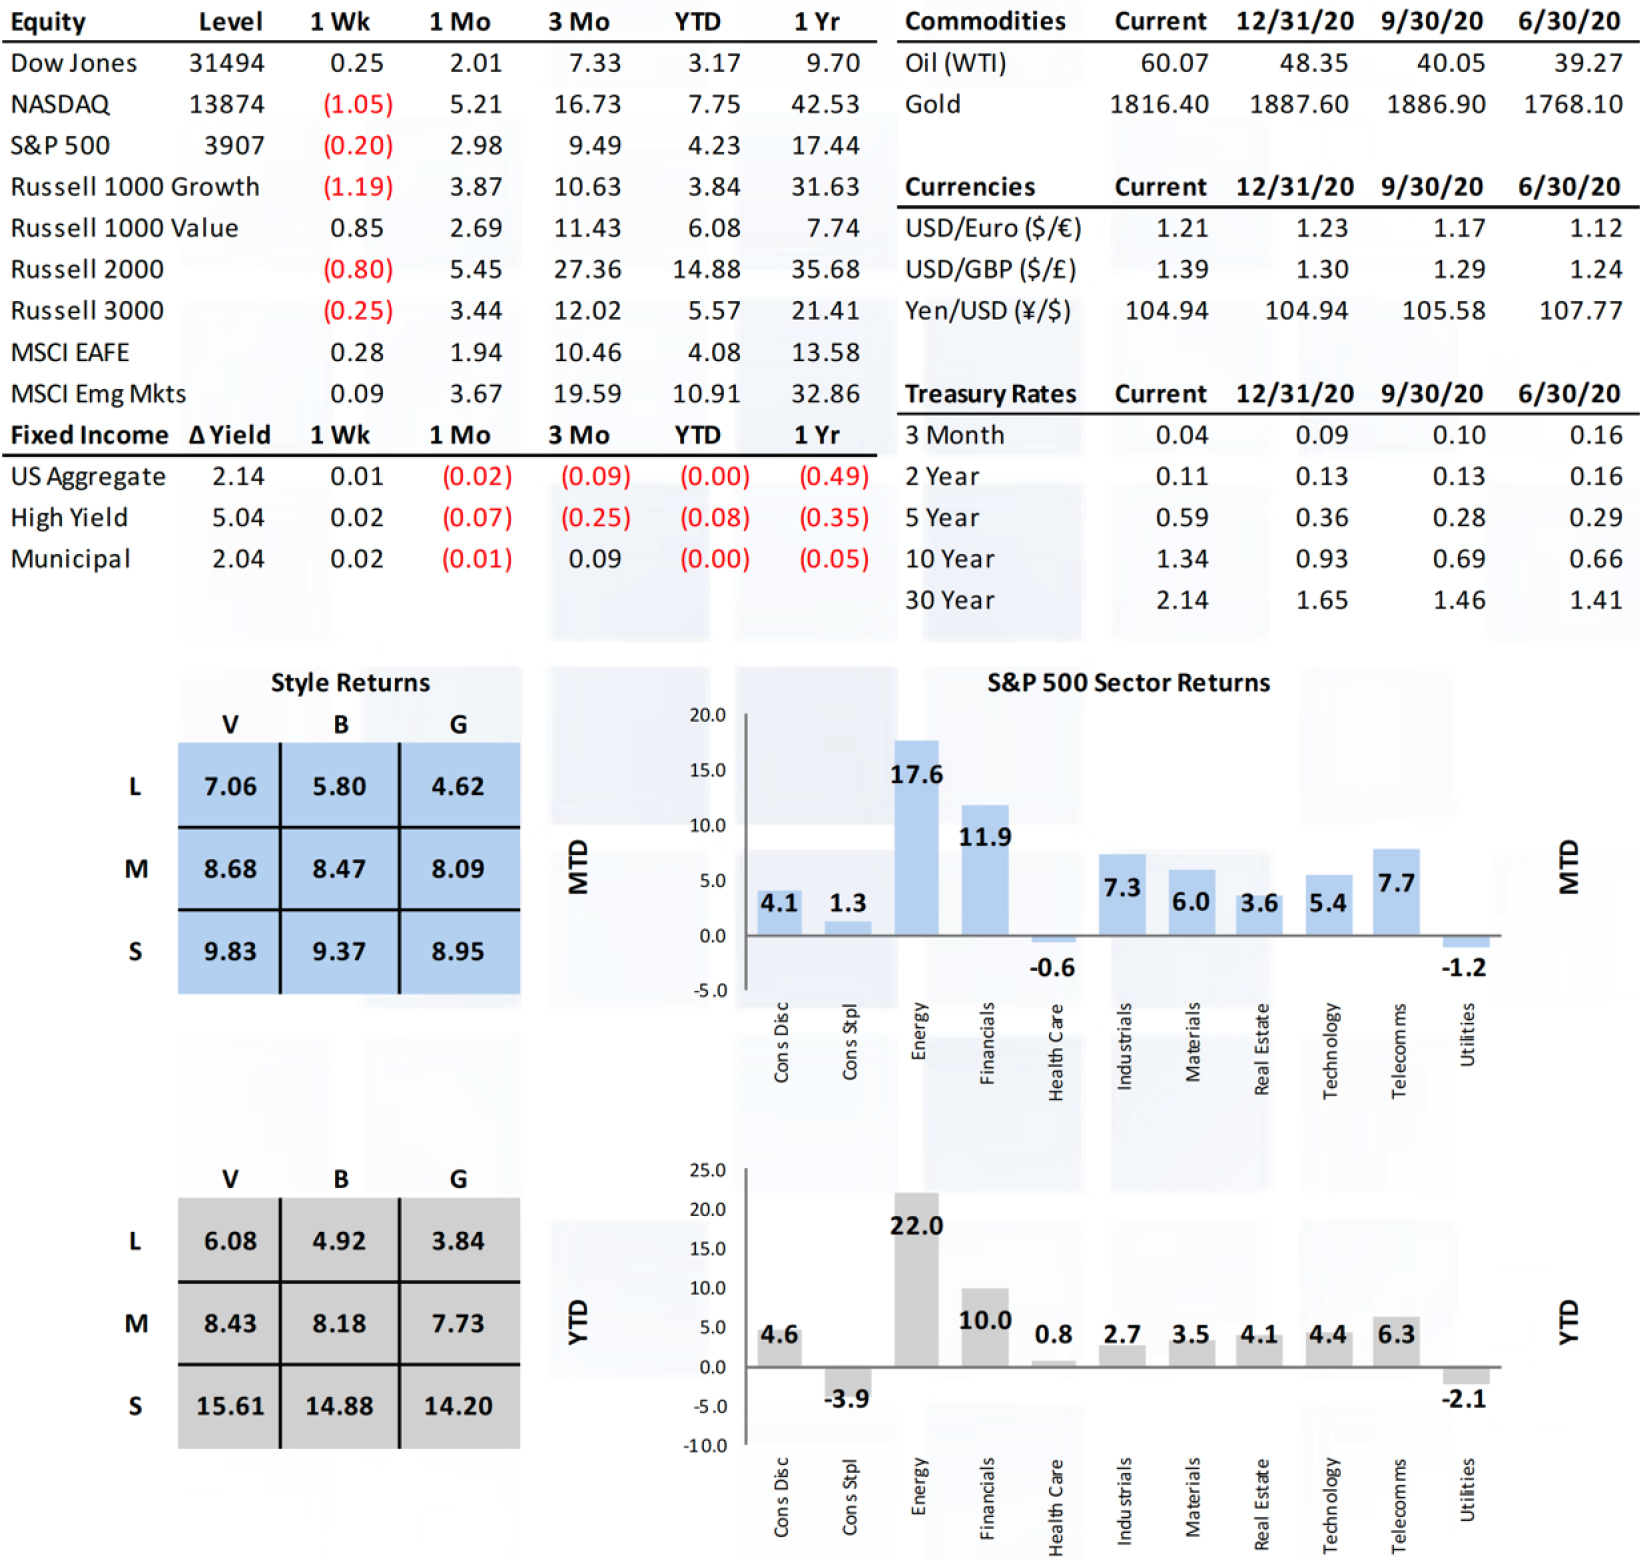
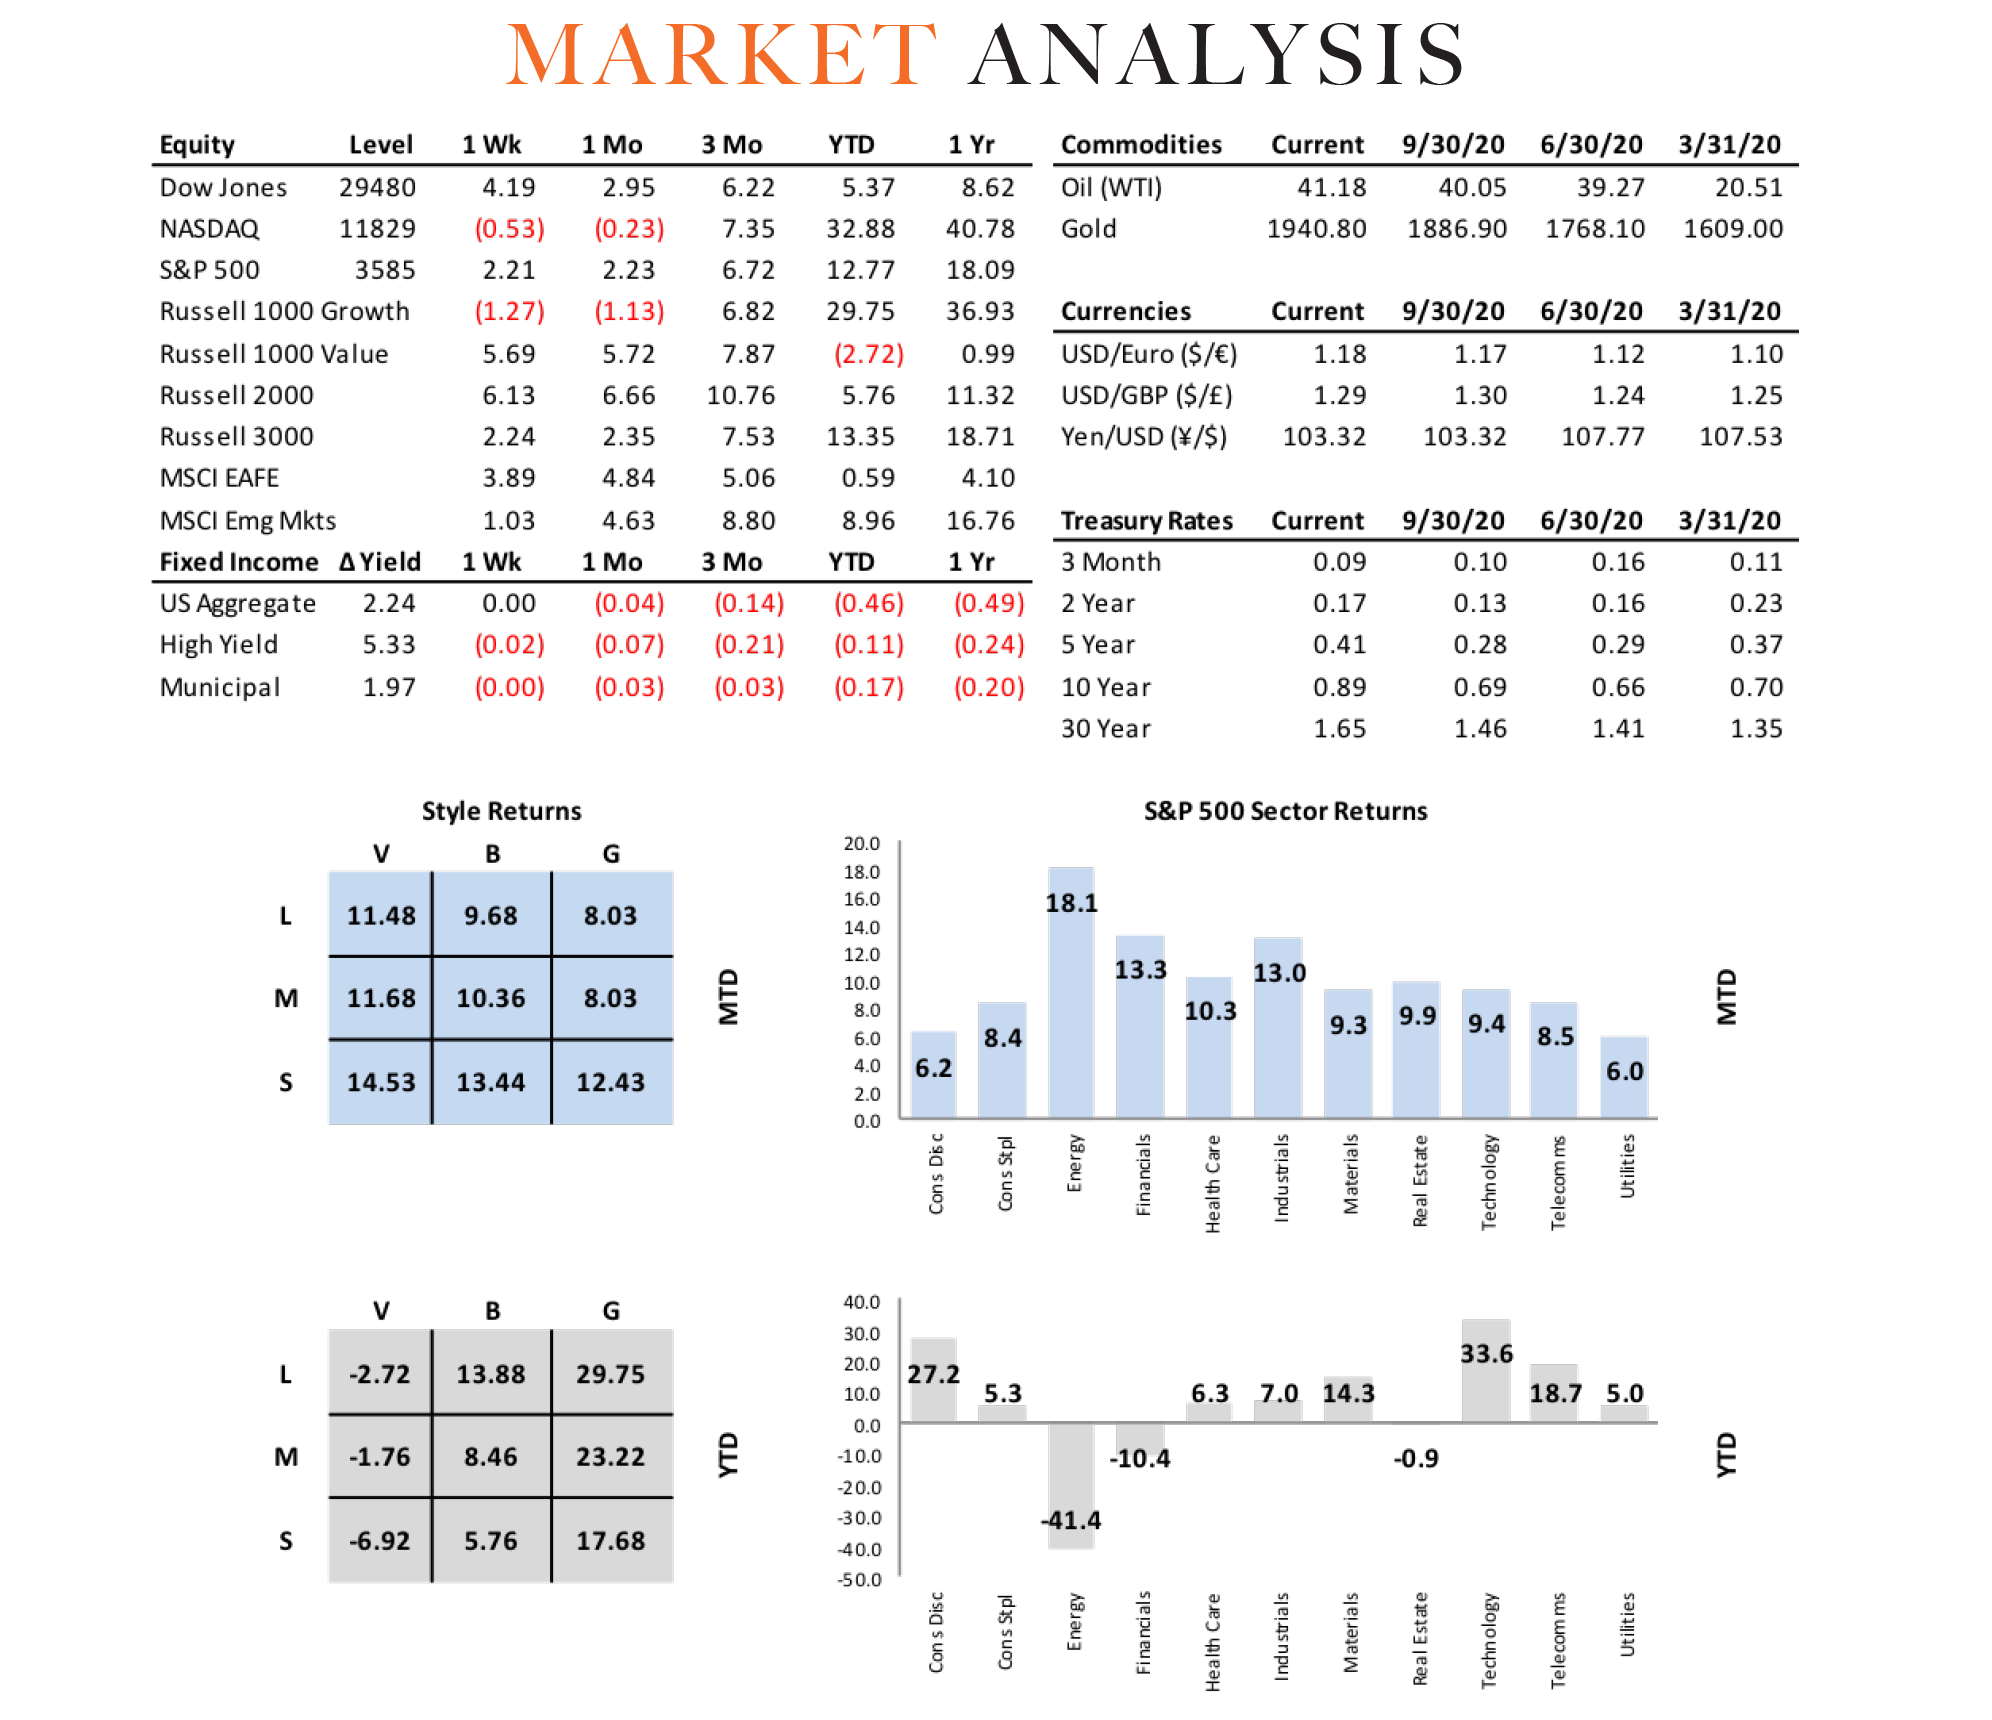
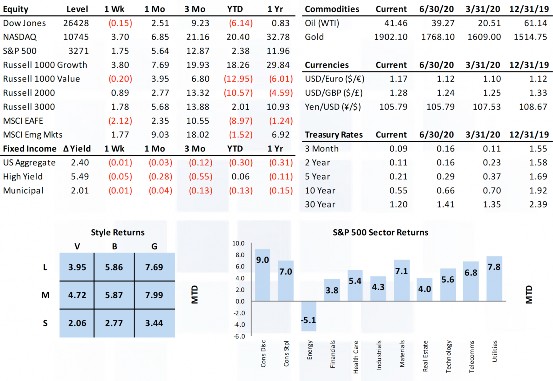
All Three Large Cap Indicies Hit New Record Highs

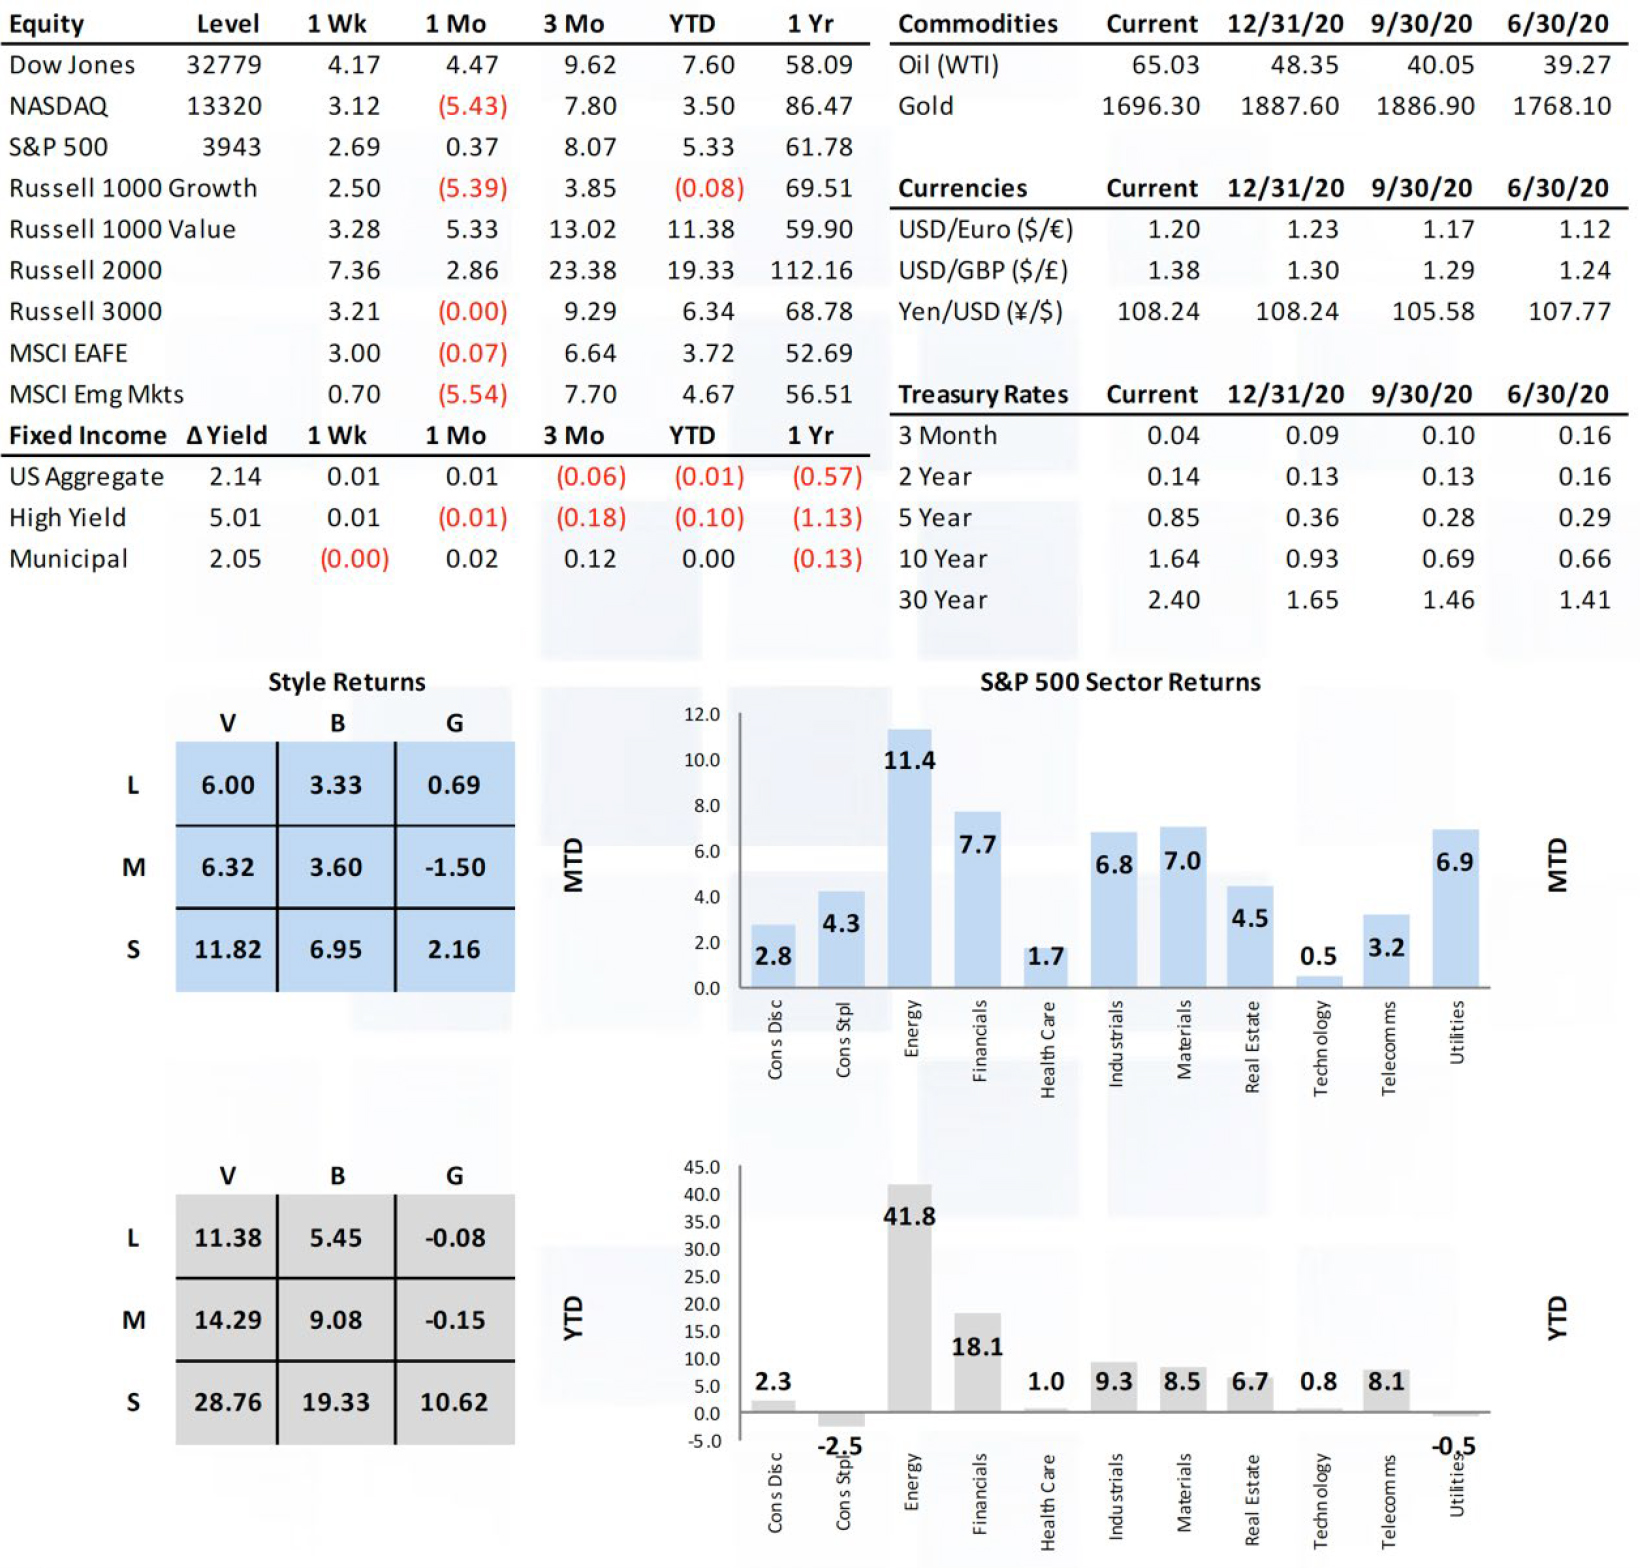
Primary drivers in the market last week included the signing of the American Recovery Act, exception­al progress on vaccine distribution, and a supportive calendar of economic reports. All three large cap U.S. indices (S&P, DJIA, NASDAQ) set new record highs while small caps surged over 7%. Gains were broad based with value/cyclicals continuing to lead the way, but we did see a strong bounce back in technology names as well. Developed and emerging international markets were up comparable to large cap U.S. markets. Both the USD and oil traded down slightly on the week. Rates moved higher in a similar fashion to recent weeks with the longer maturities rising 8 – 13 basis points and the short end remaining anchored by policy.

Market Anecdotes
•The $1.9t American Recovery Act became law last week, delivering a historic fiscal stimulus surge to many parts of the economy through stimulus checks, extended unemployment benefits, state & local government payments, Covid research/testing/vaccine distribution, and more.
•BCA Bank Credit Analyst noted con­sumers will have an estimated $2t in ex­cess savings at their disposal by April and should begin seeping into the economy as activity normalizes.
•The economic impact of fiscal stimulus (particularly this size/scope) should be to increase aggregate demand. The unknown is how much the curve will shift and how much real slack there is to soak up in the overall economy.
•Strategas made the important point that the actual re-opening and recovery in mobility/activity is the real economic stimulus, far outweighing the American Recovery Act.
•The outperformance of financials over technology since September has been pronounced but somewhat muted due to the surge in ‘non-profitable’ tech company shares.
•The NASDAQ entered correction territory on Monday but bounced off what were likely some short-term oversold conditions the remainder of the week.
•The selling of Treasuries continued last week and, like last week, the focus was not inflation fears. The slope of the 10 year and 30 year was again pretty static but the 2 year 5 year steepened again.
•Currently markets expect the Fed to begin hiking rates in November 2022, an­other in May 2023, and again in Novem­ber 2023 – notably more hawkish than the Fed’s current guidance.
•Arbor Data noted a significant part of the recent USD rally may be some short squeezes in addition to U.S. economic growth leading most non-U.S. markets.
•China’s annual National People’s Congress kicked off on Friday with the unveiling of economic targets and budgets for the year. Beijing noted GDP growth over 6%, 3% GDP, and unemployment similar to 2019 levels with a fiscal deficit target of 3.2% of GDP.
• The European Central Bank announced an increase to its Quantitative Easing scheme and left Pandemic Emergency Purchase Program (PEPP) unchanged at $2.21t until March 2022. European Union stocks rallied, and sovereign yields fell.

Economic Release Highlights
•February headline and core Consumer Price Index registered a benign 1.7% and 1.3% respectively.
•February NFIB Small Business Op­timism registered 95.8, slightly below consensus but a small improvement over January.
•The flash University of Michigan con­sumer sentiment report for March came in significantly higher than expected, rising to 83.0 (78.5 expected) and up nicely from 76.8 in February.
• January Job Openings and Labor Turnover Survey (JOLTS) report has job openings at the highest levels since Febru­ary 2020.


Investment Advisory Services are offered through Virtue Capital Management, LLC, an SEC Registered Investment Adviser. This newsletter is not to give investment advice. Before investing in any advisory product please carefully read any disclosure documents, including without limitation, the firm’s Form ADVs. Indices do not reflect the deduction of any fees or expenses. They are not available for direct investment. Exposure to an asset class represented by an index is available through investable instruments based on that index. The Dow Jones Industrial Average (DJIA) is a price-weighted average of 30 significant stocks traded on the New York Stock Exchange (NYSE) and the Nasdaq. The DJIA was designed to serve as a proxy for the broader U.S. economy. The Nasdaq Composite Index is the market capitalization-weighted index of over 3,300 common equities listed on the Nasdaq stock exchange. It is used as a broad-based market index. The S&P 500 index is designed to be a broad based unmanaged leading indicator of U.S. equities and is meant to reflect the risk/return characteristics of the large cap universe or representative of the equity market in general. The Russell 3000® Index measures the performance of the largest 3000 U.S. companies representing approximately 98% of the investable U.S. equity market. Total Return assumes dividends are reinvested. The Russell 1000 is a subset of the Russell 3000 Index. It represents the top companies by market capitalization. The Russell 1000 measures the performance of those Russell 1000 companies with higher price-to-book ratios and higher forecasted growth values. The Russell 2000 index is an index measuring the performance of approximately 2,000 small-cap companies in the Russell 3000 Index, which is made up of 3,000 of the biggest U.S. stocks. The Russell 2000 serves as a benchmark for small-cap stocks in the United States. Visit www.russell.com/indexes/ for more information regarding Russell indices. The MSCI EAFE Index is a free float-adjusted market capitalization index that is designed to measure the equity market performance of developed markets, excluding the US & Canada. The MSCI Emerging Markets Index is a free float-adjusted market capitalization index that is designed to measure equity market performance in the global emerging markets. The information published herein is provided for informational purposes only, and does not constitute an offer, solicitation or recommendation to sell or an offer to buy securities, investment products or investment advisory services. Nothing contained herein constitutes financial, legal, tax, or other advice. These opinions may not fit your financial status, risk and return profile or preferences. Investment recommendations may change, and readers are urged to check with their investment adviser before making any investment decisions. Estimates of future performance are based on assumptions that may not be realized. Past performance is not necessarily indicative of future returns or results. No representation is made as to the accuracy, completeness or timeliness of the information in this material since certain information herein is based on or derived from information provided by independent third-party sources. All enclosed material including market analysis data provided Taiber Kosmala & Associates, LLC. There is no duty to update this information. The Wilshire 5000 Total Market Index represents the broadest index for the U.S. equity market, measuring the performance of all U.S. headquartered equity securities with readily available price data. The PHLX Semiconductor Sector Index (SOX) is a capitalization-weighted index composed of 30 semiconductor companies. The companies in the Index have primary business operations that involve the design, distribution, manufacture and sale of semiconductors. The index is designed to track the performance of listed semiconductors. The Case-Shiller Index, formally known as the S&P/Case-Shiller Home Price Index is made up of several indexes that track the value of single-family detached residences using the arms-length and repeat-sales methods. It is used as a barometer not just of the housing market, but also of the health of the broader economy. For more information on the index, please visit https://www.spglobal.com/. All information obtained from Taiber Kosmala & Associates (2020. The secured overnight financing rate (SOFR) is a benchmark interest rate for dollar-denominated derivatives and loans that is replacing the London interbank offered rate (LIBOR). Interest rate swaps on more than $80 trillion in notional debt switched to the SOFR in October 2020.

Holiday Shortened Week Shows Encouraging Numbers.

The holiday shortened week saw encouraging economic prospects translate to a textbook, pro-cyclical moves across markets as evidenced by rallies in cyclical areas of the stock market, commodities, and bond yields.

The economic calendar provided a boost with robust retail sales, continued strength in the housing market, and further evidence of a strong manufacturing sector. All major indices set new record highs on Tuesday, but the S&P 500 finished the week down 0.71% due to heavy weights in technology and healthcare which struggled. Financials, materials, industrials, and energy were all positive (as was the equal weight S&P). Bond yields moved decisively higher and steeper, translating to softness in higher valuation and rate sensitive areas. The USD traded lower in step with its counter-cyclical nature while commodities moved higher (ex/oil).

Market Anecdotes
• One year ago, last Friday, the S&P 500 closed at a record high, then went on to lose 33% over the next five weeks.
• Wal-Mart’s earnings call marked the unofficial end of what was an encouraging earnings season where, despite record beat rates, stock price reactions were one of the weakest on record.
• Significant debate continued sur- rounding what level of yields will begin to prove troublesome for equities. Market internals remain encouraging at this time.
A sustained move higher in yields with a simultaneous confirmation of a shift in market internals remain a key focus.
• Developed market international stocks were up last week while emerging markets were down slightly. Both outperformed broad U.S. markets. Yield curve steepening has varied globally.
• Inflation is coming in the near term due to base effects, clear evidence of bottle- necks, and some order of pipeline effect. 5 year forward breakeven have recovered but are still not overly high.
• Fed speakers (ten last week) were busy pre-excusing the coming uptick in inflation given their intent on maintaining balance sheet operations and policy rates for the time being.
• U.S. policy developments last week included an immigration reform proposal, a walk back on prospects for student loan debt cancellation, extending foreclosure moratoriums through June 30th, officially rejoining the Paris Agreement, and the beginning of addressing tax increases.
• The stimulus package is expected to pass the House this week, followed by the Senate in early March, and POTUS signing into law mid/late March.
• The Atlanta Fed GDP Now Q1 estimate surged to 9.5% after factoring in the economic data last week (retail sales, industrial production, regional surveys).
• Former ECB President Mario Draghi officially replaced Giuseppe Conte as Italy’s new PM.
• Bloomberg reported Pfizer and BioNTech SE vaccines “appeared to stop the vast majority of recipients in Israel becoming infected, providing the first real-world indication that the immunization will curb the transmission of the coronavirus.” Economic Release Highlights
• January Retail Sales crushed consensus forecast (5.3% vs 1.1%) on the headline number as well as all sub-index metrics including ex-vehicles & gas (6.1% vs 0.5%) and control (6.1% vs 0.9%).
• January Industrial Production came in at a very solid 0.9%, beating consensus of 0.5%. Both manufacturing output and capacity utilization also came in higher than forecasted.
• February Housing Market Index (84 vs 83) was in line with estimates, continuing to reflect extraordinary positive homebuilder assessments of current housing market conditions.
• January Housing Starts (1.580M) and Permits (1.881M) missed and beat forecasts respectively after strong beats the prior two months.
• February flash Purchases Mangers Index (PMI) (M,S,C) showed near universal strength and improvement across the manufacturing sector but continued weakness in services (CoVid) with the U.S. continuing to act as a bright spot – U.S. (58.5, 58.9, 58.8), EU (57.7, 44.7, 48.1), and Japan (50.6, 45.8, 47.6).
• The February Empire State Manufacturing Index doubled consensus estimates, registering 12.1 vs a 5.7 forecast.
• The February Philly Fed Manufacturing Index came in strong at 23.1 versus forecast of 20.0.


Investment Advisory Services are offered through Virtue Capital Management, LLC, an SEC Registered Investment Adviser. This newsletter is not to give investment advice. Before investing in any advisory product please carefully read any disclosure documents, including without limitation, the firm’s Form ADVs. Indices do not reflect the deduction of any fees or expenses. They are not available for direct investment. Exposure to an asset class represented by an index is available through investable instruments based on that index. The Dow Jones Industrial Average (DJIA) is a price-weighted average of 30 significant stocks traded on the New York Stock Exchange (NYSE) and the Nasdaq. The DJIA was designed to serve as a proxy for the broader U.S. economy. The Nasdaq Composite Index is the market capitalization-weighted index of over 3,300 common equities listed on the Nasdaq stock exchange. It is used as a broad-based market index. The S&P 500 index is designed to be a broad based unmanaged leading indicator of U.S. equities and is meant to reflect the risk/return characteristics of the large cap universe or representative of the equity market in general. The Russell 3000® Index measures the performance of the largest 3000 U.S. companies representing approximately 98% of the investable U.S. equity market. Total Return assumes dividends are reinvested. The Russell 1000 is a subset of the Russell 3000 Index. It represents the top companies by market capitalization. The Russell 1000 measures the performance of those Russell 1000 companies with higher price-to-book ratios and higher forecasted growth values. The Russell 2000 index is an index measuring the performance of approximately 2,000 small-cap companies in the Russell 3000 Index, which is made up of 3,000 of the biggest U.S. stocks. The Russell 2000 serves as a benchmark for small-cap stocks in the United States. Visit www.russell.com/indexes/ for more information regarding Russell indices. The MSCI EAFE Index is a free float-adjusted market capitalization index that is designed to measure the equity market performance of developed markets, excluding the US & Canada. The MSCI Emerging Markets Index is a free float-adjusted market capitalization index that is designed to measure equity market performance in the global emerging markets. The information published herein is provided for informational purposes only, and does not constitute an offer, solicitation or recommendation to sell or an offer to buy securities, investment products or investment advisory services. Nothing contained herein constitutes financial, legal, tax, or other advice. These opinions may not fit your financial status, risk and return profile or preferences. Investment recommendations may change, and readers are urged to check with their investment adviser before making any investment decisions. Estimates of future performance are based on assumptions that may not be realized. Past performance is not necessarily indicative of future returns or results. No representation is made as to the accuracy, completeness or timeliness of the information in this material since certain information herein is based on or derived from information provided by independent third-party sources. All enclosed material including market analysis data provided Taiber Kosmala & Associates, LLC. There is no duty to update this information. The Wilshire 5000 Total Market Index represents the broadest index for the U.S. equity market, measuring the performance of all U.S. headquartered equity securities with readily available price data. The PHLX Semiconductor Sector Index (SOX) is a capitalization-weighted index composed of 30 semiconductor companies. The companies in the Index have primary business operations that involve the design, distribution, manufacture and sale of semiconductors. The index is designed to track the performance of listed semiconductors. The Case-Shiller Index, formally known as the S&P/Case-Shiller Home Price Index is made up of several indexes that track the value of single-family detached residences using the arms-length and repeat-sales methods. It is used as a barometer not just of the housing market, but also of the health of the broader economy. For more information on the index, please visit https://www.spglobal.com/. All information obtained from Taiber Kosmala & Associates (2020. The secured overnight financing rate (SOFR) is a benchmark interest rate for dollar-denominated derivatives and loans that is replacing the London interbank offered rate (LIBOR). Interest rate swaps on more than $80 trillion in notional debt switched to the SOFR in October 2020.

Rates Move Higher and Steeper, US Treasury Rates Bizarre

Rates moved both higher and steeper again last week. Curve steepening has been pronounced with the 2-10 at 1.30% and the
3m-10 at 1.40%. While bonds are oversold in the short term, the long-term trend line should eventually take yields up to the 2.0%-2.5% area.
• We saw some very bizarre US Treasury rate action last week. Tuesday saw 2 year and 30 year fractionally higher while 5 year and 10year were lower. The shortest (1bps) and longest (3bps) maturities did not move too much while 5 year were up 16bps and 10 year & 20 year were up only 10bps. A clear kink in the curve.
• Momentum and technology stocks are bearing the weight of the rise in yields. MTUM, a proxy for the broad momentum factor across the US equity market, was down over 5% across 5 days which is only the second time it has reached that degree of a selloff since March.
• Central bankers on both sides of the Atlantic did their best to assure markets last week. Powell reiterated the Fed’s commit- ment to explicit forward guidance to the Senate Banking Committee and offered reassuring views on inflation and the rise
in yields. Lagarde and Schnabel also made clear the ECB will ensure there will be no unwarranted tightening of financing condi- tions.
• In the past, dovish braying and big QE helped stocks AND bonds but recently markets have been behaving as if there has been a shift in market psychology translat- ing to a change in bond yield to stock price correlation.
• Inflation remained a key focus of market participants last week. BCA noted West Texas Intermediate prices rising 70% since October alongside correlation data between gasoline prices and headline inflation.
• In a separate research note, BCA ad-dressed several myths surrounding 1970’s style inflation relative to today.
• Strategas reiterated confidence in the overall market due to continued internal market dynamics such as reopening pairs, BB/BBB spreads, CD vs CS, high beta vs low beta, advance/decline ratios, and cycli-cal sector performance.
• The $1.9t stimulus package passed the HOR and is heading to the Senate. Strategas estimates approximately $700b of consumer related stimulus will hit within the next six months.

Economic Release Highlights

• January Personal Income and Outlays report showed MoM personal income (10% vs 9.4%) and personal consumption (2.4% vs 2.2%) both higher than expected while core PCE was in generally in line with expectations at MoM (0.3% vs 0.1%) and YoY (1.5% vs 1.4%).
• December’s Case-Shiller Home Price Index rose more than expected for a second consecutive month at MoM (1.3%a vs 1.0%e) and YoY (10.1%a vs 9.6%e).
• New (923k vs 855k) and Pending
(-2.8%a vs 0%e) Home Sales were mixed with new exceeding pending continuing to lag.
• Conference Board Consumer Confi-dence for February came in higher than expected (91.3 vs 90.0) but remained somewhat subdued.
• The final UofM Consumer Sentiment for February remained at the relatively subdued level of 76.8a vs 76.4e.
• January Durable Goods Orders acceler-ated faster than expected (3.4% vs 1.1%), well over December’s 0.5%, providing further evidence of an upward trending manufacturing cycle.


Investment Advisory Services are offered through Virtue Capital Management, LLC, an SEC Registered Investment Adviser. This newsletter is not to give investment advice. Before investing in any advisory product please carefully read any disclosure documents, including without limitation, the firm’s Form ADVs. Indices do not reflect the deduction of any fees or expenses. They are not available for direct investment. Exposure to an asset class represented by an index is available through investable instruments based on that index. The Dow Jones Industrial Average (DJIA) is a price-weighted average of 30 significant stocks traded on the New York Stock Exchange (NYSE) and the Nasdaq. The DJIA was designed to serve as a proxy for the broader U.S. economy. The Nasdaq Composite Index is the market capitalization-weighted index of over 3,300 common equities listed on the Nasdaq stock exchange. It is used as a broad-based market index. The S&P 500 index is designed to be a broad based unmanaged leading indicator of U.S. equities and is meant to reflect the risk/return characteristics of the large cap universe or representative of the equity market in general. The Russell 3000® Index measures the performance of the largest 3000 U.S. companies representing approximately 98% of the investable U.S. equity market. Total Return assumes dividends are reinvested. The Russell 1000 is a subset of the Russell 3000 Index. It represents the top companies by market capitalization. The Russell 1000 measures the performance of those Russell 1000 companies with higher price-to-book ratios and higher forecasted growth values. The Russell 2000 index is an index measuring the performance of approximately 2,000 small-cap companies in the Russell 3000 Index, which is made up of 3,000 of the biggest U.S. stocks. The Russell 2000 serves as a benchmark for small-cap stocks in the United States. Visit www.russell.com/indexes/ for more information regarding Russell indices. The MSCI EAFE Index is a free float-adjusted market capitalization index that is designed to measure the equity market performance of developed markets, excluding the US & Canada. The MSCI Emerging Markets Index is a free float-adjusted market capitalization index that is designed to measure equity market performance in the global emerging markets. The information published herein is provided for informational purposes only, and does not constitute an offer, solicitation or recommendation to sell or an offer to buy securities, investment products or investment advisory services. Nothing contained herein constitutes financial, legal, tax, or other advice. These opinions may not fit your financial status, risk and return profile or preferences. Investment recommendations may change, and readers are urged to check with their investment adviser before making any investment decisions. Estimates of future performance are based on assumptions that may not be realized. Past performance is not necessarily indicative of future returns or results. No representation is made as to the accuracy, completeness or timeliness of the information in this material since certain information herein is based on or derived from information provided by independent third-party sources. All enclosed material including market analysis data provided Taiber Kosmala & Associates, LLC. There is no duty to update this information. The Wilshire 5000 Total Market Index represents the broadest index for the U.S. equity market, measuring the performance of all U.S. headquartered equity securities with readily available price data. The PHLX Semiconductor Sector Index (SOX) is a capitalization-weighted index composed of 30 semiconductor companies. The companies in the Index have primary business operations that involve the design, distribution, manufacture and sale of semiconductors. The index is designed to track the performance of listed semiconductors. The Case-Shiller Index, formally known as the S&P/Case-Shiller Home Price Index is made up of several indexes that track the value of single-family detached residences using the arms-length and repeat-sales methods. It is used as a barometer not just of the housing market, but also of the health of the broader economy. For more information on the index, please visit https://www.spglobal.com/. All information obtained from Taiber Kosmala & Associates (2020. The secured overnight financing rate (SOFR) is a benchmark interest rate for dollar-denominated derivatives and loans that is replacing the London interbank offered rate (LIBOR). Interest rate swaps on more than $80 trillion in notional debt switched to the SOFR in October 2020.

Global markets make sharp rally first week in February.

The week ending February 5th saw global equity markets rally sharply, a steepening yield curve, and a strong bid for USDs and commodities.

Market focus last week was the peak of the fourth quarter earnings season and a pretty heavy economic calendar. The S&P 500 (+4.65%) and R2000 (+7.7%) both returned to record high territory, quickly erasing the consolidation over the past week. With earnings season more behind us than in front, market attention will likely turn to policy developments and the intertwined nature of COVID progression and the trajectory of economic data.

Market Anecdotes

• Several high-profile earnings reports last week have brought us to the back half of the season and the positive results continued. Blended earnings per FactSet moved to positive territory at 1.7% and reported revenue of 2.7%.
• Energy stocks moved sharply higher again last week (+8.3%) and are the leading performers year to date (+12.2%) by a factor of 2.
• Democrats appear set on reconciliation in the Senate for the stimulus bill. The $600b Republican proposal was deemed ‘too small’ by Democrats.
• Senator Klobuchar introduced the first antitrust reform legislation last week which funds Fair Trade Committee and Department of Jobs enforcement and shifts the burden of proof from the government to the companies.
• The U.S. may see U.S. Treasury bill yields trade into negative territory, not due to policy rates but rather due to a temporary reduction in supply with a backdrop of consistently high demand.
• The Bank of Europe reduced 2021 growth forecasts from 7.25% to 5.0% but made no change to policy. While it made clear they have no plans to take rates to negative interest rate policy, they did instruct banks to begin preparations.
• The US dollar has been in rally mode since early January. The Bloomberg Dollar index has increased approximately 2% and reclaimed its 50-Day Moving Average in the process.
• Slow but improving CoVid-19 trends remained evident. U.S. daily vaccinated rate hit over 1.5mm last week. Global vaccinated rates are over 4.5mm. Extrapolating current trends may see over 65mm vaccinated by the end of March with herd immunity by Q320.

Economic Release Highlights

• The January employment report disappointed with payrolls rising less than half of expectations (49k vs 105k) but the unemployment rate falling more than expected (6.3% vs 6.7%).
• January Institute Supply Management (ISM) Manufacturing index of 58.7 registered just shy of the (red hot) consensus 60.0. January ISM Services index also came in at 58.7, handily above the 56.8 consensus.
• The final U.S. Purchase Manager’s Index (PMI) readings came in well above December levels and beat estimates for January.
• The JPM Global PMI index saw the composite and services fall slightly in January to 52.3 and 51.6 respectively while manufacturing improved to 53.5.
• January EU PMI came in slightly better than forecast but did soften from December’s level due to virus impacts. December EU retail sales increased 2%.
• Eurozone 4Q GDP contracted -0.7% quarter over quarter and by -5.1% year over year. Both indicators came in higher than the -1.7% and -6.0% forecasted consensus respectively.

W E E K E N D I N G  2 / 05 / 21

INSIGHT
MARKET ANALYSIS


The S&P 500 sees healthy gains during holiday week

The holiday shortened Thanksgiving week began with a third consecutive Monday morning booster shot (AstraZeneca) which sustained throughout the week leaving the S&P 500 with a healthy 2.3% gain.

U.S. small cap, developed, and emerging market equities again outperformed U.S. large caps. The ‘risk-on’ trade took cyclical parts of the market higher with banks, energy, and materials leading the way while REITs, healthcare, and consumer staples lagged. The S&P 500 is now up 7.99% since Election Day and up 12.6% for the year. Commodity markets were up sharply with industrial metals and oil (+8%) rallying while gold lost more ground, now back below its 200dma. Longer duration treasury rates edged slightly higher with the 10 year U.S. Treasuary now at 0.84% but shorter rates remained anchored.

Market Anecdotes
• Alpine Macro addressed ‘bubble’ and mania valuation sentiments in a recent equity strategy piece highlighting the differences between Nifty Fifty ‘72, Tech Bubble (‘00), and FANMAG (‘20).
• Ned Davis made note of near-term excessive optimism they see in the market, likely stemming from recent vaccine and political developments.
• Leuthold Group highlighted the relatively attractive valuation for small caps, making the case that both SCV (17x) and SCG (24x) are historically cheap relative to historical averages. Small growth is trading at approximately 50% of valuation measures it reached in ‘00.
• Commodities, particularly copper, continued to benefit from the strong bid for cyclical assets, up 3.22% last week. For the first time since 2011, all 18 major commodity indices are above their 200 DMA.
• The Fed is expected to ramp up longer duration UST purchases in light of the Treasury announcement of sunsetting Fed bond facilities and may now be considering supplemental monetary action at their upcoming December meeting.
• The weekly Fed balance sheet report showed the consolidated balance sheet surging $67b to a new record $7.24t. The ECB balance sheet marked a new high last week as well.
• Biden has stepped up pressure on the Democratic caucus to move more meaningfully toward the Republican offer, putting his weight behind a compromise smaller lame duck package.
• Barings highlighted capital inefficiencies currently prevailing in private equity where 70% ($366b) of capital raised from ‘15-’19 is targeting large cap businesses which account for less than 1% of firms (2,000). Only 7% ($37b) of raised capital is targeting lower middle market businesses which account for nearly 96% of firms (440k).

Economic Release Highlights
• November flash U.S. PMIs (C, S, M) all came in handily above consensus and now are now deeply in expansionary territory at 57.9, 56.7, and 57.7 respectively.
• EZ PMIs (45.1, 53.6, 41.3) missed expec-tations while the U.K. (47.4, 55.2, 45.8) beat handily across the board.
• October’s Personal Income and Outlays report revealed disappointing personal income (-0.7% v 0.1%) but in line PCE growth of 0.5%. Core PCE price index was in line as well at 1.4% YoY.
• October durable goods report came in higher than expected across headline (1.3% v 0.9%), Ex-transports (1.3% v 0.3%), and core goods (0.7% v 0.6%) components.
• Conference Board consumer confidence for November came in short of consensus (96.1 v 98.0) likely reflecting the CoVid surge and policy uncertainty in the coming months.
• November’s final University of Michigan consumer sentiment reading fell to 76.9, short of con-sensus estimate of 77.2, likely a reflection of Republican initial sentiment after the election.
• Case-Shiller House Price Index continued its torrid pace in September, coming in well above expectations (1.3% v 0.5% MoM) (6.6% v 5.4% YoY) across the 20 metro region samples.

W E E K E N D I N G  11 / 27 / 2 0

INSIGHT
MARKET ANALYSIS


Vaccine news puts positive charge into equity markets

Good news on the vaccine front last week put a positive charge into equity markets which after an up and down week left the S&P 500 at a new record high. Uncertainties of CoVid fiscal relief and a December 11th government funding deadline chipped away at Monday’s exuberance – the safe bet is that we’ll see more vaccine related news well before DC provides any clarity on the fiscal front. The S&P 500 ended last week with a 2.16% gain, taking YTD returns back into double digit territory (+11%). Energy, financials, industrials, and real estate led the way while tech, communications (FB, GOOG), and consumer discretionary (AMZN) lagged. Oil jumped 7% driving commodity markets higher while the yield curve steepened and the USD strengthened mostly against the safe haven Japanese Yen and Swiss Franc.

Market Anecdotes
• The extraordinary 90% efficacy of the Pfizer vaccine report was far in excess of market expectations, resulting in a massive rotation into cyclical recovery areas of the market and away from technology bellwethers that have been carrying the water most of the year.
• Pfizers’ vaccine trial and its 90% efficacy rate is on par with childhood measles and smallpox vaccines, far beyond efficacy expectations, and significantly greater than seasonal flu vaccines (30%-50%). Ten other vaccines are in late-stage trials as well and are expecting similar results.
• Early week reports on vaccine progress, while encouraging, do present risks to the near-term outlook. Logistical challenges, skepticism regarding safety, virus mutations, anticipatory rising yields, and waning urgency for fiscal support are all tangible risk factors looking forward.
• It’s become clear that weather does indeed influence CoVid transmission. With winter in the northern hemisphere we are seeing a surge in cases while reported deaths in the southern hemisphere are 61% below their July peak. U.S. positivity rates are the highest since May.
• The technical backdrop has improved significantly. Strategas noted a surge to 70% of new 20-day highs was one of the highest readings in over 50 years and a sign of encouraging internal momentum. Value, small caps, spreads, and market breadth are also painting a good picture. • Schumer/McConnell dividing line of $500b to $2.2t Hero’s Act and the nomination of Judy Shelton for Fed Governor may be setting markets up for some DC negotiation volatility. 13.5mm Americans currently receiving unemployment benefits will lose them at the end of the year.
• FOMC members were busy on the speaking circuit (virtually) last week making the usual post meeting rounds. Ten addresses throughout the week largely reiterating the Fed party line.
• The U.S. Treasury auctioned off $122b of new paper last week with each coupon being record sized. Thursday’s $27b of 30-year bonds was the largest duration issuance of treasury bonds in U.S. history. No surprise that the uptake was a bit weak.
• A worthwhile reminder is that negative real yields, while troublesome for bonds, are ultra-accommodative to equities. YTD 2020 has seen 5yr, 10yr, and 30yr real yields move from -0.05%, 0.08%, 0.50% to -1.23%, -0.83%, and -0.24%.

Economic Release Highlights
• AAII bullish sentiment which has been modest all year despite the rally, surged last week to 55.84% on election outcome and vaccine news. Bespoke noted this is the highest bullish reading since early 2018 and in the top 94% dating back to survey inception in 1987.
• Throughout the new bull market since the March lows, AAII’s sentiment reading has notably been a bit of a head scratcher as bullish sentiment remained muted despite the return to new all-time highs. In the last few weeks, optimism had been finally starting to rise but remained relatively modest.
• Headline and core CPI for October came in at 1.2% and 1.6% annual rates respectively while monthly rates for both measures were 0.0% on the button.
• The October NFIB small business optimism index came in slightly below expectations ((104.0 vs 104.8) but held onto September’s 3.8 point upside surprise. • September JOLTS job openings of 6.438 came in lower than expected reflecting a slight uptick in job market activity.
• November (p) UofM consumer sentiment fell unexpectedly to 77.0 (82.0 consensus) from prior month 81.8, in what may reflect the initial part of the election drama.

W E E K E N D I N G  11 / 13 / 2 0

INSIGHT
MARKET ANALYSIS


Markets surge in wake of presidential election outcome

Equity markets surged (6%-7%) to their best showing since April last week as election outcomes began to materialize.

With Senate outcomes still in limbo, markets cheered what looks like a gridlock scenario with Vice President Joe Biden taking the White House and market friendly policy compromises thanks to mixed Congressional power. Healthcare and technology led the way while energy and real estate lagged. Commodities benefited from a risk on rally in oil and long treasury bonds surged initially on contested election news bits but stayed suppressed due to a reduced likelihood of a sizable CoVid relief package.

Market Anecdotes
• After the worst pre-election stock market week on record, the S&P 500 delivered its best week since April as the election outcome and policy handicapping began to clear up.
• Tax hikes, infrastructure spending, green new deal, healthcare reform, regulation, and tech sector vilification have taken a back seat under a divided government scenario. The end of the trade wars, more modest CoVid fiscal relief, and eliminated tariffs are also likely.
• Emerging markets have benefited materially from the GOP Senate / Biden White House driven by currency implications of a weak USD due to lower interest rates (growth), lower Treasury issuance (deficit spending), and more stable foreign and trade policies.
• With 89% reported, FactSet noted record beat rates of 86% and margins of 19.5% for a blended Year over Year earnings decline of -7.5%. Revenue is coming in at -2.1% with record beats (79%) and margin (2.6%) of beats.
• The October FOMC meeting happened last week. As expected, no change in policy and they stand ready to enact fresh QE along with other measures if deemed necessary.
• The Bank of England surprised the markets by announcing £150 billion of quantitative easing. This was £50 billion more than expected.
• BCA pointed out an important sub-component of last week’s GDP report is that the contribution from state & local government spending turned negative as it did in 2009/2010 where it remained a drag until 2014 – a significant contributor to subpar GFC recovery growth.
• CoVid is becoming more prevalent in the U.S. as the “third surge” does not seem yet to be slowing down.
• European and Canadian approaches to health policy/lockdowns are being closely watched as proxies for full spring 2020 style versus partial targeted approach.
• The September Black Knight Mortgage Monitor showed a slight improvement in delinquencies and record originations.

Economic Release Highlights
• The October jobs report was strong with 638,000 new jobs taking the unemployment rate down to 6.9% (7.6% expected) and non-farm, private, and manufacturing payrolls all topping expectations.
• October’s U.S. manufacturing PMI improved slightly to 53.4 while the ISM manufacturing surged and crushed expectations (59.3 v 55.7). The Composite improved from 54.3 to 56.9 in October.
• The global manufacturing PMI was 53.3, an improvement from 52.1 prior reading. The European Union registered a healthy 54.8, China 53.6, India 58.6 and Germany 58.2.
• October’s ISM services index softened slightly to 56.6 from last month’s 57.8 reading.

W E E K E N D I N G  11 / 06 / 2 0

INSIGHT
MARKET ANALYSIS


One of the Most Remarkable Market Trips in History

Global equity indices marked new record highs last week, capping off what has truly been one of the most remarkable market round trips in history. The Bloomberg World Equity Index fell over 30% in a month last spring and went on to rally 45% over the following five months. The S&P 500 came within a whisper of its February high on an intraday basis with smaller caps and cyclicals (industrials, energy, materials) leading the way as participation continued to broaden out. Treasuries had a rough week with long yields climbing nearly 20bps in a steepening yield curve. Gold snapped a nine-week win streak, falling 4.3%.

Market Anecdotes

• Bespoke noted last week marked 100 days since the March lows during which the S&P 500 rallied 51.3%, a 100-day rally magnitude that we’ve not seen since 1933.
• While U.S. markets are back at record high levels, Europe’s STOXX 600 is still down more than 10% from its 2020 high (local FX terms) and the Nikkei is 5% below its January high.
• It sounds bizarre but technology is the sixth best performing sector here in 3Q with industrials (transports), materials, and consumer discretionary leading the way. Act IV?
• 2Q earnings season is largely behind us with over 90% of companies reporting. With an e-beat rate over 80% we can firmly categorize the quarter as far better than expected.
• Real estate casualties of COVID are beginning to emerge. Manhattan apartment vacancies hit a record 4.33% in July, new leases in NW Queens fell 60% with median rent rates falling 15%. Macys is expected to vacate its Mag Mile location in Chicago.
• CRE loans are much more pronounced in smaller regional and community banks (28%) than they are for larger banks (13%) according to the FDIC.
• The leveraged loan index has recovered from the high 70’s to the low 90s since March but default rates have climbed from 0.87% to 3.70% while high yield bond defaults have climbed above 6%.
• POTUS executive orders last week assured markets and should garner goodwill at the polls, but legality, practicality and efficacy are in question. There is only $44 billion of available federal money for unemployment benefits and states wherewithal to fund the rest makes clear the need for congress and the senate to act to avoid fiscal tightening.
• Strategas notes global central bank balance sheets are growing 33% YoY, driven mostly by the ECB and BoJ (Fed has stalled at around $7b since middle May). Additionally, money supply (M2 YoY) is growing at a 23% clip.
• COVID trends in the U.S. continue to drift lower including a 7.31% positivity rate (lowest since July 1st), average daily rate of new cases (lowest levels since 7/7), while deaths and hospitalizations decline as well. Meanwhile, other countries have started to see renewed upticks including India, Japan, Germany, France, and Spain.

Economic Release Highlights

• U.S. retails sales growth of 1.2% missed expectations for 2.1% growth but put spending back to pre-COVID levels and actually beat on ex-Autos (1.9% v 1.3%) and ex-Autos & Gas (1.5% v 1.0%). June was also revised notably higher as well from 7.5% to 8.4%.
• The JOLTS (Job Opening and Labor Turnover Survey) showed an increase in U.S. job openings in June, rising to 5.9mm, only 5.288mm was expected. Initial jobless claims of 963k is the first time we’ve been below 1mm since March.
• NFIB Small Business Optimism registered 98.8, shy of expectations of 100 and last month’s 100.6 reading.
• UofM consumer sentiment changed little, moving from 72.5 to 72.8 in early August.
• CPI headline and core came in slightly higher than expectations with readings of 1.0% and 1.6% respectively.
• PPI came in higher than expected (0.6%a vs 0.3%e) but was shrugged off and didn’t have any impact on futures markets.

W E E K E N D I N G  8 / 14 / 2 0

INSIGHT
MARKET ANALYSIS


Equity Markets Post Healthy Gains Closing Strong

Last week, equity markets bolted on to some already pretty gaudy results of the past several weeks, coming within 1% of February’s record high on an intraday basis. The first full week of August felt pretty bullish with all U.S. equity classes and sectors posting healthy gains and only Brazil was left out of the non-U.S. equity market rally. Market internals last week favored cyclicals (industrials, financials, energy) over defensives (health care, utilities, consumer staples).

Market Anecdotes

• DC negotiators failed to reach a stimulus deal and remained pretty far apart (trillions of dollars and different sets of facts). POTUS executive orders were expected to bridge the gap over the weekend which is why markets are remaining calm for now.
• COVID data seems to be taking a modestly positive turn over the past two weeks. Confirmed cases have fallen 18% since July 23 while positivity rates, deaths, and hospitalization rates are falling as well.
• Despite a significant mega cap tech rally late last week, this week saw value and smaller caps lead the way.
• Earnings season is maintaining a clear positive skew with earnings and sales beat rates of 68% and 62%. A net guidance spread of +18.6% is also extraordinarily positive.
• Ned Davis pointed out, on average, the stock market bottoms four months prior to the end of recession and earnings/revenue bottom six and nine months after the end of recession.
• Bloomberg highlighted at least 25 major retailers have gone BK this year. Chapter 11 allows them to walk away from leases translating to CMBS delinquencies, now 16% from 3.8% in Jan.
• A 2Q NY Fed report shows total household debt declining for the first time since 2014. Credit card balances fell $76b, the steepest margin on record while mortgage balances fell by $63b.
• The big story on Tuesday was the 2% rally in gold that pushed the December futures contract to a new record high of $2,027.30. Negative real rates, particularly with the U.S. joining that club have factored materially into the picture for gold.
• The USD is down 10% from its March highs, now below 93 for the first time since May 2018.
• The BCA Pipeline Inflation Indicator has troughed suggesting bond yields have limited downside risk looking forward.

Economic Release Highlights

• The July jobs report was solid at 1.76mm (1.675mm expected) and the unemployment rate falling to 10.2%. U-6 under-employment rate fell to 16.5% and participation stalled out at 61.4%.
• All but three of eleven major global services and manufacturing PMIs moved back into expansionary territory.
• July PMI (50.9a vs 51.3e) and ISM (58.1a vs 55e) manufacturing indices both marked improvement over the prior months, now both officially residing in expansionary territory.
• July PMI (50.0a vs 49.6e) and ISM (54.2a vs 53.5e) services indices both marked improvement over the prior months, now both officially residing in expansionary territory.
• The ISM commodities survey pointed to upside price risk across the commodity markets with a +20 net reading, the highest since October 2018 and the fourth highest ‘short supply’ response (24) on record.
• Initial jobless claims (weekly) declined to 1.186mm from last week’s 1.435mm but still sit two-times higher than what we saw during the GFC.
• July motor vehicle sales of 14.5mm (11.2 domestic) grew handily over June’s 13.1mm and came in well over expectations of 14.0mm.


W E E K E N D I N G  8 / 07 / 2 0

INSIGHT
MARKET ANALYSIS

US Markets Close Out July on Strong Note

Equity markets closed out July on a strong note with the S&P 500 up 1.7% while international and emerging markets were down. European stocks fell 3% on the week. Mega cap growth stocks plowed through Congressional interrogations and posted strong earnings to lead markets higher but cyclical areas of the market (energy, materials, financials) lagged. A federal fiscal stimulus renewal package remained elusive to and through expiration of enhanced benefits on Friday. Commodities lost 0.64% driven by oil moving back toward the $40 range but gold continued its march higher, +3.3% last week. Rates moved lower in a parallel fashion leaving the 10yr UST at 0.55% and the USD fell 1.15%.

Market Anecdotes

• The stock market shrugged off fiscal inaction in DC, sustained CoVid-19 wave data, and a grilling of tech execs in DC, giving way to encouraging earnings and economic reports.
• Virus news seems to be slowly transitioning to a less threatening trajectory with new case averages and CoVid-19 doctor visits finally turning back down.
• Over 700 companies had reported through Thursday. FactSet is reporting earnings beat rate of 84% on a -35.7% bottom line.
• Fiscal stimulus negotiations missed the 7/31 soft deadline, as Congress adjourned last Thursday. Recess ends 8/3 and the hope is they make quick work of meeting in the middle.
• While the negative incentive of increased unemployment benefits is clear, that assumes employers are hiring with ample job openings but job openings are currently 23% lower than the beginning of the year, making a strong case for demand stimulus checks of any sort.
• Does the parabolic increase in government debt portend disaster with gold rallying and the USD falling? Not yet says BCA. If disaster was imminent, it is highly unlikely we would have a 0.55% 10yr and 1.20% 30yr UST yields. Inflation recalibrating? Probably.
• Last week saw gold eclipse the prior record high of $1920.7 back in September 2011.
• The Fed meeting last week produced no surprises. QE forever, a twinkie will decompose before they raise rates, and they see no negative implications of these policies whatsoever.
• The Fed balance sheet has stalled at around $7tn, actually declining $15.7b since May 13th.
• More positive homebuilders news with DHI beating by 31% on the bottom line and 3.6% on the top with encouraging closings, orders, and backlog data as well.
• The tech sector weighting is now over 27%, just shy of the ‘99 29.18% high water mark. Energy slipped to 2.5%, a new record low and far below the 13.14% weight in 2008.
• ICI released MF/ETF flows through June, confirming bond product took in flows of over $100b, a record amount.
• AAII bullish sentiment fell to 20.23%, a lower level than at any time during the CoVid-19 crisis. Bearish sentiment sits at 48.47%, just 3.6% below the 3/26 reading which climbed over 50%.

Economic Release Highlights

• Q2 U.S. GDP dropped a record 9.5% QoQ and 32.9% YoY in what the IMF has coined “The Great Lockdown”.
• June personal income fell 1.1% in June (after -4.4% in May) but consumer spending increased +5.6% on the month.
• Initial jobless claims moved higher last week to 1.4mm in the July 25th week and continuing claims rose to 17.0mm (for the week prior).
• Durable goods orders rose 7.3% in June (only 5.4% expected), driven by a surge in vehicle orders. Ex-transports and ex-aircraft both rose a more modest 3.3%.
• Real-time activity data such as mobility data, restaurant reservations, airport travel stats, and the NY Fed weekly index have faded in July alongside the CoVid-19 resurgence.
• UofM consumer confidence softened in July to 72.5.

W E E K E N D I N G  7 / 31 / 2 0

INSIGHT
MARKET ANALYSIS