
4th of July Week Markets End With a Healthy Bang.
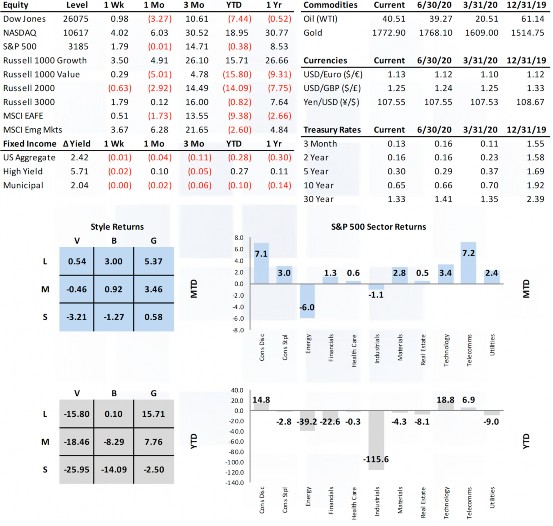
Fourth of July fireworks continued into last week with strong bookends (M&F) delivering healthy gains driven once again by larger cap and tech-oriented names. The S&P 500 finished up 1.8% while small caps lost 0.64%. Strength at the top end of the market cap weighted S&P 500 continued to be pronounced. Commodities posted a respectable 1.52% gain on the back of a rally in industrial and precious metals (WTI was flat). Neither rates nor credit spreads moved meaningfully either way but the USD lost ground for a third consecutive week.
Market Anecdotes
• FactSet reports the estimated 2Q earnings decline is -44.6% which, if met, would mark the largest year-over-year decline in earnings reported by the index since Q4 2008 (-69.1%). The forward 12-month P/E ratio for the S&P 500 is 21.8.
• BCA made an interesting case that combining analysts’ expected temporary decline in earnings with the actual decline in real bond yields translates to a 15% increase in S&P 500 fair value since 12/31/19.
• Bespoke dissected the market rally since March 23 lows into three distinct ‘Acts’, the initial rally (3/23-5/13), the reopening rally (5/13-6/8), and a renewed tech/FAANG rally.
• An amazing testament to the turnaround rally is seen in the NASDAQ 100 (QQQ) which was up 10% on the year into February, collapsed over 30% on CoVid-19 developments in March, then went on to rally to a 20% YTD gain by mid-July.
• Tesla, not even a member of the S&P 500, surpassed Toyota this week as the world’s largest global automobile company (by market cap).
• Citadel indicated retail volume is now approximately 15% of volume but surges to nearly 25% during market peaks.
• Put/call ratio has plummeted since late March leaving the five-day average in the bottom 1% of all readings since 2001, according to Bespoke.
• The Philly SOX made a convincing breakout through prior resistance levels (February and June).
• The NY Fed WEI improved for a tenth consecutive week last week after enduring twelve consecutive weeks of deterioration ending with a new low water mark of -11.48 on April 25th.
• Google search trends (vacation, used car, RV, dentist, hotel, salon) show consumers are ready for some self-care and travel, just not by air or water.
• While we expect posturing aplenty in DC over the next two weeks, we caution investors that it was a mistake to bail in March and every time the debt-ceiling issue came to the forefront in the past.
• U.S. Treasury released details on the PPP last week claiming the program retained over 31mm jobs across a wide range of industries.
• China’s stock market has made both headlines and substantial gains over the past few weeks. The Shanghai Index is +16% over the past 20 days, helped in part by an SOE newspaper making a strong case for domestic investors not to miss out on the ‘bull market.’
Economic Release Highlights
• The June PMI Service index improved from May’s 37.5 read to 47.9, above consensus and outside of the top end of forecasted range.
• June’s ISM Non-Manufacturing Index improved from May’s 45.4 to a 57.1, above consensus and outside of the top end of forecasted range.
• June’s ISM Composite Index jumped to 56.6, its highest level since February 2019.
• May’s JOLTS was expected to show openings falling 3% to 4.9mm (after April’s 16% drop),but instead increased to 5.397mm.
W E E K E N D I N G 7 / 1 0 / 2 0
INSIGHT
MARKET ANALYSIS