One of the Most Remarkable Market Trips in History

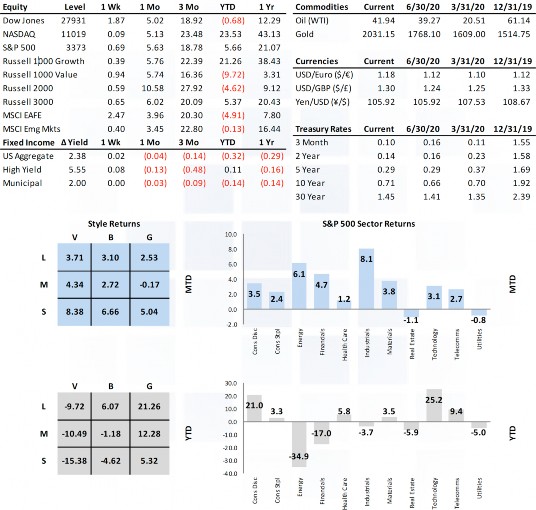
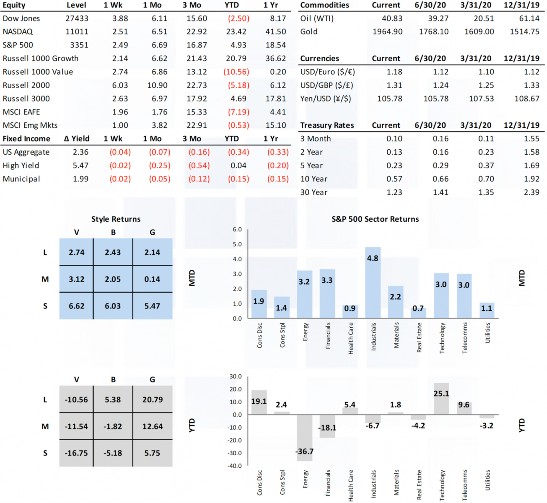
Global equity indices marked new record highs last week, capping off what has truly been one of the most remarkable market round trips in history. The Bloomberg World Equity Index fell over 30% in a month last spring and went on to rally 45% over the following five months. The S&P 500 came within a whisper of its February high on an intraday basis with smaller caps and cyclicals (industrials, energy, materials) leading the way as participation continued to broaden out. Treasuries had a rough week with long yields climbing nearly 20bps in a steepening yield curve. Gold snapped a nine-week win streak, falling 4.3%.

Market Anecdotes

• Bespoke noted last week marked 100 days since the March lows during which the S&P 500 rallied 51.3%, a 100-day rally magnitude that we’ve not seen since 1933.
• While U.S. markets are back at record high levels, Europe’s STOXX 600 is still down more than 10% from its 2020 high (local FX terms) and the Nikkei is 5% below its January high.
• It sounds bizarre but technology is the sixth best performing sector here in 3Q with industrials (transports), materials, and consumer discretionary leading the way. Act IV?
• 2Q earnings season is largely behind us with over 90% of companies reporting. With an e-beat rate over 80% we can firmly categorize the quarter as far better than expected.
• Real estate casualties of COVID are beginning to emerge. Manhattan apartment vacancies hit a record 4.33% in July, new leases in NW Queens fell 60% with median rent rates falling 15%. Macys is expected to vacate its Mag Mile location in Chicago.
• CRE loans are much more pronounced in smaller regional and community banks (28%) than they are for larger banks (13%) according to the FDIC.
• The leveraged loan index has recovered from the high 70’s to the low 90s since March but default rates have climbed from 0.87% to 3.70% while high yield bond defaults have climbed above 6%.
• POTUS executive orders last week assured markets and should garner goodwill at the polls, but legality, practicality and efficacy are in question. There is only $44 billion of available federal money for unemployment benefits and states wherewithal to fund the rest makes clear the need for congress and the senate to act to avoid fiscal tightening.
• Strategas notes global central bank balance sheets are growing 33% YoY, driven mostly by the ECB and BoJ (Fed has stalled at around $7b since middle May). Additionally, money supply (M2 YoY) is growing at a 23% clip.
• COVID trends in the U.S. continue to drift lower including a 7.31% positivity rate (lowest since July 1st), average daily rate of new cases (lowest levels since 7/7), while deaths and hospitalizations decline as well. Meanwhile, other countries have started to see renewed upticks including India, Japan, Germany, France, and Spain.

Economic Release Highlights

• U.S. retails sales growth of 1.2% missed expectations for 2.1% growth but put spending back to pre-COVID levels and actually beat on ex-Autos (1.9% v 1.3%) and ex-Autos & Gas (1.5% v 1.0%). June was also revised notably higher as well from 7.5% to 8.4%.
• The JOLTS (Job Opening and Labor Turnover Survey) showed an increase in U.S. job openings in June, rising to 5.9mm, only 5.288mm was expected. Initial jobless claims of 963k is the first time we’ve been below 1mm since March.
• NFIB Small Business Optimism registered 98.8, shy of expectations of 100 and last month’s 100.6 reading.
• UofM consumer sentiment changed little, moving from 72.5 to 72.8 in early August.
• CPI headline and core came in slightly higher than expectations with readings of 1.0% and 1.6% respectively.
• PPI came in higher than expected (0.6%a vs 0.3%e) but was shrugged off and didn’t have any impact on futures markets.

W E E K E N D I N G  8 / 14 / 2 0

INSIGHT
MARKET ANALYSIS


Equity Markets Post Healthy Gains Closing Strong

Last week, equity markets bolted on to some already pretty gaudy results of the past several weeks, coming within 1% of February’s record high on an intraday basis. The first full week of August felt pretty bullish with all U.S. equity classes and sectors posting healthy gains and only Brazil was left out of the non-U.S. equity market rally. Market internals last week favored cyclicals (industrials, financials, energy) over defensives (health care, utilities, consumer staples).

Market Anecdotes

• DC negotiators failed to reach a stimulus deal and remained pretty far apart (trillions of dollars and different sets of facts). POTUS executive orders were expected to bridge the gap over the weekend which is why markets are remaining calm for now.
• COVID data seems to be taking a modestly positive turn over the past two weeks. Confirmed cases have fallen 18% since July 23 while positivity rates, deaths, and hospitalization rates are falling as well.
• Despite a significant mega cap tech rally late last week, this week saw value and smaller caps lead the way.
• Earnings season is maintaining a clear positive skew with earnings and sales beat rates of 68% and 62%. A net guidance spread of +18.6% is also extraordinarily positive.
• Ned Davis pointed out, on average, the stock market bottoms four months prior to the end of recession and earnings/revenue bottom six and nine months after the end of recession.
• Bloomberg highlighted at least 25 major retailers have gone BK this year. Chapter 11 allows them to walk away from leases translating to CMBS delinquencies, now 16% from 3.8% in Jan.
• A 2Q NY Fed report shows total household debt declining for the first time since 2014. Credit card balances fell $76b, the steepest margin on record while mortgage balances fell by $63b.
• The big story on Tuesday was the 2% rally in gold that pushed the December futures contract to a new record high of $2,027.30. Negative real rates, particularly with the U.S. joining that club have factored materially into the picture for gold.
• The USD is down 10% from its March highs, now below 93 for the first time since May 2018.
• The BCA Pipeline Inflation Indicator has troughed suggesting bond yields have limited downside risk looking forward.

Economic Release Highlights

• The July jobs report was solid at 1.76mm (1.675mm expected) and the unemployment rate falling to 10.2%. U-6 under-employment rate fell to 16.5% and participation stalled out at 61.4%.
• All but three of eleven major global services and manufacturing PMIs moved back into expansionary territory.
• July PMI (50.9a vs 51.3e) and ISM (58.1a vs 55e) manufacturing indices both marked improvement over the prior months, now both officially residing in expansionary territory.
• July PMI (50.0a vs 49.6e) and ISM (54.2a vs 53.5e) services indices both marked improvement over the prior months, now both officially residing in expansionary territory.
• The ISM commodities survey pointed to upside price risk across the commodity markets with a +20 net reading, the highest since October 2018 and the fourth highest ‘short supply’ response (24) on record.
• Initial jobless claims (weekly) declined to 1.186mm from last week’s 1.435mm but still sit two-times higher than what we saw during the GFC.
• July motor vehicle sales of 14.5mm (11.2 domestic) grew handily over June’s 13.1mm and came in well over expectations of 14.0mm.


W E E K E N D I N G  8 / 07 / 2 0

INSIGHT
MARKET ANALYSIS

US Markets Close Out July on Strong Note

Equity markets closed out July on a strong note with the S&P 500 up 1.7% while international and emerging markets were down. European stocks fell 3% on the week. Mega cap growth stocks plowed through Congressional interrogations and posted strong earnings to lead markets higher but cyclical areas of the market (energy, materials, financials) lagged. A federal fiscal stimulus renewal package remained elusive to and through expiration of enhanced benefits on Friday. Commodities lost 0.64% driven by oil moving back toward the $40 range but gold continued its march higher, +3.3% last week. Rates moved lower in a parallel fashion leaving the 10yr UST at 0.55% and the USD fell 1.15%.

Market Anecdotes

• The stock market shrugged off fiscal inaction in DC, sustained CoVid-19 wave data, and a grilling of tech execs in DC, giving way to encouraging earnings and economic reports.
• Virus news seems to be slowly transitioning to a less threatening trajectory with new case averages and CoVid-19 doctor visits finally turning back down.
• Over 700 companies had reported through Thursday. FactSet is reporting earnings beat rate of 84% on a -35.7% bottom line.
• Fiscal stimulus negotiations missed the 7/31 soft deadline, as Congress adjourned last Thursday. Recess ends 8/3 and the hope is they make quick work of meeting in the middle.
• While the negative incentive of increased unemployment benefits is clear, that assumes employers are hiring with ample job openings but job openings are currently 23% lower than the beginning of the year, making a strong case for demand stimulus checks of any sort.
• Does the parabolic increase in government debt portend disaster with gold rallying and the USD falling? Not yet says BCA. If disaster was imminent, it is highly unlikely we would have a 0.55% 10yr and 1.20% 30yr UST yields. Inflation recalibrating? Probably.
• Last week saw gold eclipse the prior record high of $1920.7 back in September 2011.
• The Fed meeting last week produced no surprises. QE forever, a twinkie will decompose before they raise rates, and they see no negative implications of these policies whatsoever.
• The Fed balance sheet has stalled at around $7tn, actually declining $15.7b since May 13th.
• More positive homebuilders news with DHI beating by 31% on the bottom line and 3.6% on the top with encouraging closings, orders, and backlog data as well.
• The tech sector weighting is now over 27%, just shy of the ‘99 29.18% high water mark. Energy slipped to 2.5%, a new record low and far below the 13.14% weight in 2008.
• ICI released MF/ETF flows through June, confirming bond product took in flows of over $100b, a record amount.
• AAII bullish sentiment fell to 20.23%, a lower level than at any time during the CoVid-19 crisis. Bearish sentiment sits at 48.47%, just 3.6% below the 3/26 reading which climbed over 50%.

Economic Release Highlights

• Q2 U.S. GDP dropped a record 9.5% QoQ and 32.9% YoY in what the IMF has coined “The Great Lockdown”.
• June personal income fell 1.1% in June (after -4.4% in May) but consumer spending increased +5.6% on the month.
• Initial jobless claims moved higher last week to 1.4mm in the July 25th week and continuing claims rose to 17.0mm (for the week prior).
• Durable goods orders rose 7.3% in June (only 5.4% expected), driven by a surge in vehicle orders. Ex-transports and ex-aircraft both rose a more modest 3.3%.
• Real-time activity data such as mobility data, restaurant reservations, airport travel stats, and the NY Fed weekly index have faded in July alongside the CoVid-19 resurgence.
• UofM consumer confidence softened in July to 72.5.

W E E K E N D I N G  7 / 31 / 2 0

INSIGHT
MARKET ANALYSIS